How to Fix Core Web Vitals: The Sequence That Gets Small Business Sites to 'Good' Fastest
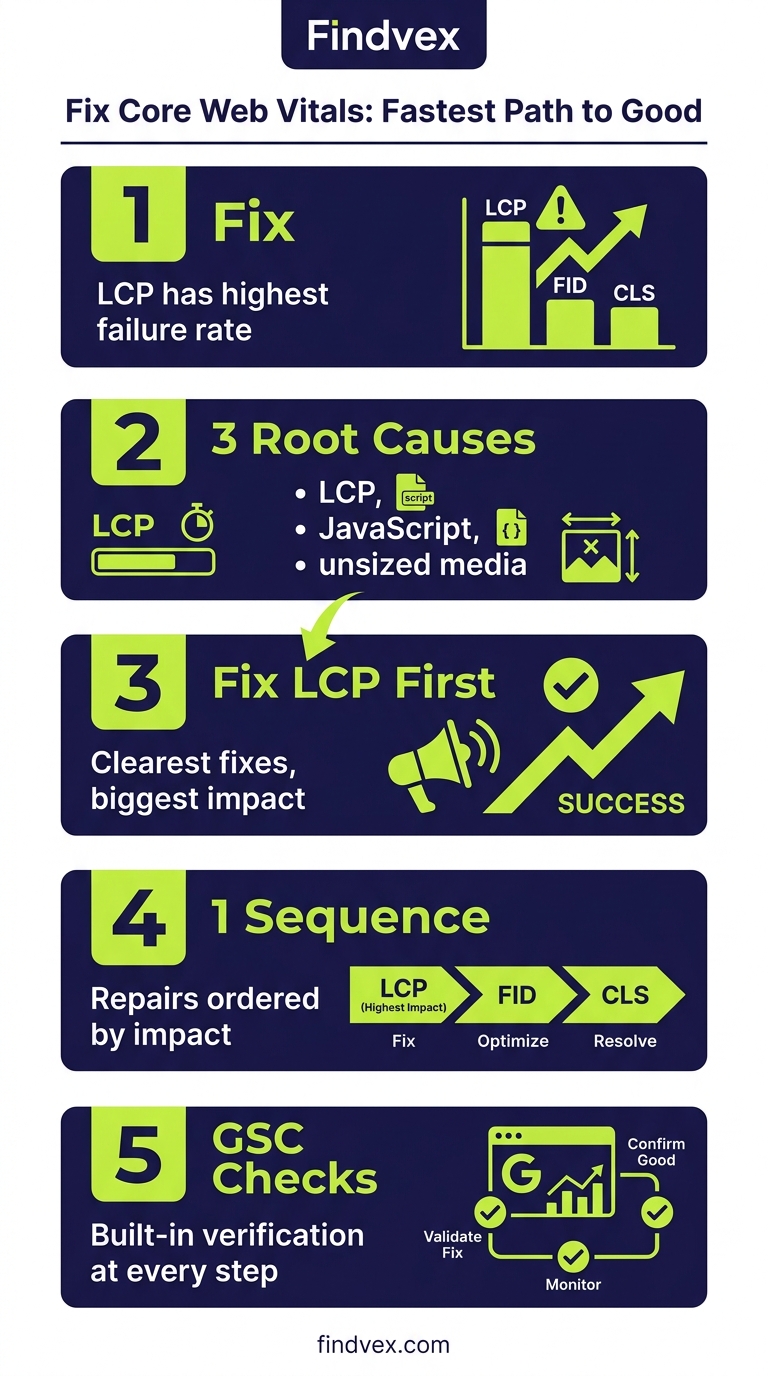
Core Web Vitals failures almost always trace back to three root causes: a slow LCP element, heavy JavaScript blocking interaction, or unsized media causing layout shift. Fix LCP first — it has the highest failure rate and the clearest fixes. This guide sequences every repair in order of impact, with specific GSC checks and developer handoff notes.
Quick answer
To fix Core Web Vitals: (1) Open Google Search Console → Experience → Core Web Vitals and identify which metric is failing — LCP, INP, or CLS. (2) Fix LCP first by preloading your hero image, switching to a faster host, and removing render-blocking resources. (3) Fix CLS by adding explicit width/height to all images and iframes, and reserving space for ads and embeds. (4) Fix INP by auditing third-party scripts and breaking up long JavaScript tasks. After deploying fixes, wait up to 28 days for field data in GSC to reflect the change.
Section 1
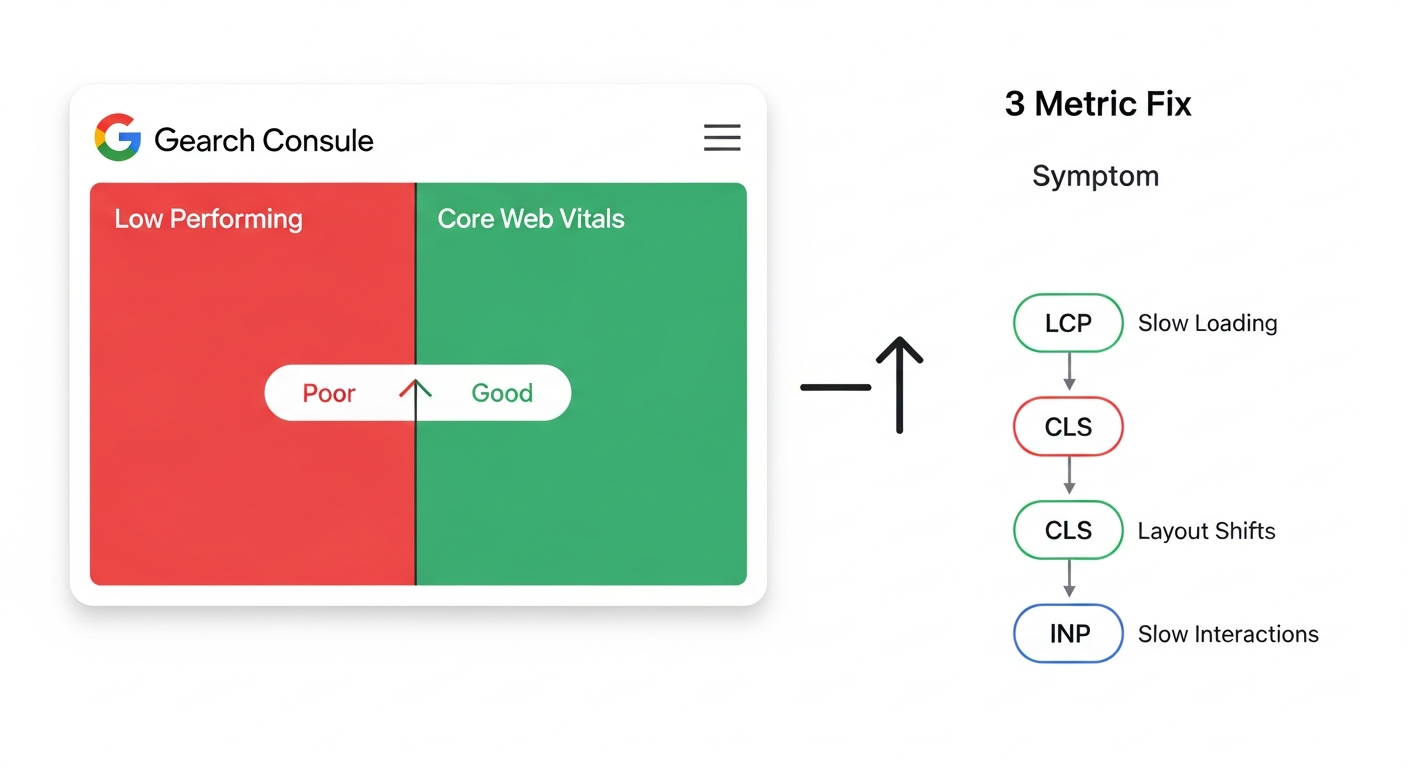
If your Core Web Vitals report in Google Search Console shows red or amber, you have a specific, diagnosable performance problem — not a vague 'slow site' situation. The three metrics (LCP, INP, CLS) each point to a different technical failure, and they each have a different fix owner, timeline, and risk level.
Most small business websites fail on LCP first. That is the right place to start. This guide sequences the repairs in the order that moves you from 'Poor' to 'Good' fastest, explains what to check yourself versus what to hand to a developer, and tells you exactly where to look in Google Search Console at each stage.
What a Core Web Vitals Failure Actually Means for Your Rankings
Core Web Vitals are a confirmed Google ranking signal under the Page Experience update. Google evaluates them using field data — real user measurements collected via Chrome — not lab scores from PageSpeed Insights. This distinction matters: you can score 95/100 in PageSpeed Insights and still fail in Search Console if your real visitors (on slower connections or mobile devices) are having a poor experience.
Google's threshold for 'Good' is measured at the 75th percentile of page loads. That means 75% of your real visitors need to meet the threshold — not the average. A single slow page template (e.g., your product listing page) dragging down the 75th percentile can fail the entire URL group.
The SEO impact is a tiebreaker signal: when two pages are otherwise equivalent in relevance and authority, the one with better Core Web Vitals ranks higher. For competitive local niches, this tiebreaker frequently decides who appears in the local pack and who sits just outside it. If you are already running solid on-page SEO and local signals, fixing Core Web Vitals is often the highest-leverage remaining technical lever. See our overview of what Core Web Vitals mean for SEO and which metrics business owners should prioritize first.
There is also a direct conversion effect that is separate from rankings: pages with high CLS frustrate users who mis-tap shifted buttons; high LCP means visitors are waiting too long to see your main content and may bounce before it loads.
“AI agents do in hours what teams used to do in weeks. The advantage compounds.”
Start Here: What to Check in Google Search Console
Before touching any code, spend five minutes in Search Console to understand exactly which metric is failing, on which device, and on which URL templates. Fixing the wrong thing first wastes developer time.
- Navigate to: Search Console → Experience → Core Web Vitals → Open 'Mobile' report first (mobile failures are almost always worse than desktop)
- Note which status each URL group shows: Poor (red), Needs Improvement (amber), or Good (green)
- Click into a 'Poor' URL group — Search Console will show you the specific failing metric (LCP, INP, or CLS) along with example URLs
- Export the example URLs — these are the actual pages Google measured, and you'll test them individually in PageSpeed Insights
- Switch to the 'Desktop' tab and repeat — desktop and mobile often fail on different metrics
- Check the chart for the date when the status changed — if it coincided with a plugin update, theme change, or new ad script, you have your likely culprit
- If you see 'No Data Available,' it means Google has not collected enough field data from real Chrome users on your site — you need to drive more traffic or wait; lab tools like PageSpeed Insights are your only diagnostic option in this case
Core Web Vitals Diagnosis Checklist
Work through this checklist before writing a single line of fix code. Diagnosis first prevents wasted effort.
- ☐ Run the failing URL in PageSpeed Insights (pagespeed.web.dev) — analyze both Mobile and Desktop tabs
- ☐ Identify the LCP element: PageSpeed Insights shows this explicitly under 'Largest Contentful Paint element' — it is almost always a hero image or H1 text block
- ☐ Check if the LCP image has fetchpriority="high" or a <link rel="preload"> tag — missing this is the single most common LCP failure on small business sites
- ☐ Check if the LCP image is lazy-loaded (loading="lazy") — this is a guaranteed LCP killer when applied to above-the-fold images
- ☐ Identify all layout shift contributors: PageSpeed Insights lists CLS elements under 'Avoid large layout shifts' — look for images without dimensions, iframes, and font swaps
- ☐ Check Time to First Byte (TTFB) under 'Server Response Times' — if TTFB is above 800ms, your hosting or server-side caching is the bottleneck, and no front-end optimization will fully fix LCP
- ☐ Identify long tasks: in the PageSpeed Insights 'Opportunities' section, look for 'Reduce JavaScript execution time' and 'Minimize main-thread work' — these are your INP causes
- ☐ Open Chrome DevTools → Performance tab → record a page load and look for red 'Long Task' markers (tasks over 50ms on the main thread)
- ☐ List all third-party scripts loading on the page (Google Tag Manager, chat widgets, review widgets, ad scripts) — third parties are a disproportionate source of both LCP delay and INP problems
- ☐ Test on a throttled mobile connection in PageSpeed Insights — real mobile users on 4G are the benchmark, not your office fiber connection
Fix LCP First: The Largest Contentful Paint Repair Sequence
LCP measures how long it takes for the largest visible content element to render. For most small business websites, that element is a hero image or banner photo. The good threshold is under 2.5 seconds; above 4 seconds is poor.
LCP has four sequential sub-problems. Fix them in this order because each one gates the next: (1) resource load delay, (2) element discovery delay, (3) render delay, (4) TTFB.
- Remove lazy loading from your hero image. If your LCP image has loading="lazy" in its HTML, remove it immediately. Lazy loading tells the browser to defer the image — the exact opposite of what you want for above-the-fold content. Risk level: Low. Owner: Developer or page builder settings.
- Add fetchpriority="high" to the LCP image tag. This tells the browser to prioritize this resource over other images. Example: <img src="hero.webp" fetchpriority="high" alt="...">. Risk level: Low. Owner: Developer.
- Add a preload hint in the <head>. Include <link rel="preload" as="image" href="hero.webp"> before any render-blocking scripts. On WordPress, this can be added via a plugin like Perfmatters or manually in functions.php. Risk level: Low-Medium. Owner: Developer.
- Convert the LCP image to WebP or AVIF format. Modern image formats reduce file size by 25–50% compared to JPEG/PNG with equivalent quality. Most image optimization plugins (Imagify, ShortPixel, Smush) handle this automatically. Risk level: Low. Owner: Site admin with plugin.
- Fix your TTFB if it exceeds 600ms. Check your server response time in PageSpeed Insights. If TTFB is the bottleneck, the fixes are: switch to a host with LiteSpeed or NVMe-based servers, enable full-page caching (not just browser caching), or add a CDN with edge caching. Risk level: Medium (hosting changes require testing). Owner: Hosting provider / developer.
- Eliminate render-blocking resources above the fold. Scripts and stylesheets in the <head> that block rendering delay LCP. Defer non-critical JavaScript using the 'defer' or 'async' attribute. Inline critical CSS and load the rest asynchronously. Risk level: Medium-High (can break layout if done wrong). Owner: Developer.
- Serve images from a CDN. If your hero image is served from your origin server in a single location and your customers are geographically distributed, CDN delivery cuts load time significantly. Services like Cloudflare (free tier) or BunnyCDN handle this. Risk level: Low. Owner: Site admin / developer.
Fix CLS: Cumulative Layout Shift Causes and Repairs
CLS measures visual instability — elements that shift after initial render and cause users to mis-click or lose their place. The good threshold is a CLS score under 0.1. CLS is often the fastest metric to fix because most causes are HTML attribute omissions rather than architectural problems.
CLS failures are categorized in Search Console under specific cause labels. The most common on small business sites are: images without dimensions, web fonts causing FOUT (flash of unstyled text), and dynamically injected content (ads, cookie banners, chat widgets) that displaces existing content.
- Add width and height attributes to every image and video. This is the single most impactful CLS fix. Without dimensions, the browser cannot reserve space for the image before it loads, so the page reflows when it appears. Example: <img src="photo.jpg" width="800" height="600" alt="...">. Modern WordPress generates these automatically for images added via the media library — but images added via page builders or custom HTML often lack them. Risk level: Low. Owner: Developer / content manager.
- Add explicit aspect-ratio CSS to responsive images. For fluid-width images, set aspect-ratio in CSS so the browser maintains the correct space: img { aspect-ratio: 16/9; width: 100%; }. Risk level: Low. Owner: Developer.
- Reserve space for ads and embeds. If you display Google AdSense or other ad units that load after the page renders, they push content down. Set a min-height on the ad container that matches the tallest expected ad unit. Risk level: Low. Owner: Developer / ad manager.
- Fix font loading to prevent FOUT. Use font-display: optional or font-display: swap in your CSS @font-face declarations. Preload critical fonts: <link rel="preload" as="font" href="font.woff2" crossorigin>. Risk level: Low-Medium (font-display: optional can cause invisible text if font doesn't load fast enough). Owner: Developer.
- Push cookie banners and chat widgets below the fold or animate them in without displacing content. Overlays that inject above existing content are a common CLS source. If you cannot remove them, ensure they use position: fixed so they overlay rather than displace content. Risk level: Low. Owner: Developer / marketing.
- Check for back/forward cache (bfcache) CLS issues. Pages restored from bfcache can trigger CLS if JavaScript re-runs and re-renders content. Test this in Chrome DevTools by navigating back after visiting an external link. Risk level: Low. Owner: Developer.
Fix INP: Interaction to Next Paint (The Hardest One to Debug)
INP replaced FID (First Input Delay) as a Core Web Vital in March 2024. It measures the latency of all interactions throughout the page visit — not just the first one. The good threshold is under 200ms; above 500ms is poor.
INP is the most technically complex of the three metrics because it requires JavaScript profiling rather than simple HTML fixes. It is also the metric most likely to require developer involvement. That said, the majority of INP failures on small business sites trace back to third-party scripts, not custom code — which means the first diagnostic step is simple.
Symptoms: users report clicking buttons or menus and experiencing a delay before anything happens. On mobile, this manifests as a tap that seems to be ignored before the UI finally responds.
- Audit third-party scripts first. Open PageSpeed Insights and look under 'Reduce the impact of third-party code.' Common culprits: live chat widgets (Intercom, Drift, Tidio), review widgets (Trustpilot inline scripts), video embeds (YouTube iframes), and tag managers firing multiple marketing pixels. Each one adds main-thread work that delays interaction response. Risk level: Medium (removing scripts requires sign-off from marketing). Owner: Developer + site owner decision.
- Load third-party scripts after the page is interactive. Use the 'facade' pattern for embeds: replace YouTube embeds with a static thumbnail that loads the actual iframe only on click. For chat widgets, delay initialization until the user has been idle for 3–5 seconds. Risk level: Medium. Owner: Developer.
- Break up long JavaScript tasks. Any single JS task running longer than 50ms on the main thread can delay interaction response. Use Chrome DevTools Performance tab to identify long tasks. The fix is code-splitting: break the task into smaller chunks using setTimeout, requestIdleCallback, or scheduler.yield() (if targeting modern browsers). Risk level: High (requires code changes). Owner: Developer.
- Reduce DOM size. Pages with more than ~1,400 nodes take longer to query and update, increasing interaction latency. This is common on WordPress sites using heavy page builders that generate deeply nested HTML. Risk level: Medium. Owner: Developer / theme.
- Defer or remove unused JavaScript. PageSpeed Insights will flag JS files that are loaded but mostly unused on the page. Each kilobyte of unused JS that must be parsed adds main-thread pressure. On WordPress, plugins often enqueue JS site-wide even when only needed on one page. Use Query Monitor or Asset CleanUp Pro to scope JS loading per page type. Risk level: Medium. Owner: Developer.
Platform-Specific Fix Notes: WordPress, Shopify, and Custom Sites
The root causes of CWV failures are the same regardless of platform, but the fix implementation differs. Here is where to look on the most common platforms.
- WordPress: The most impactful single change is switching to a performance-focused host (one with server-side LiteSpeed cache or full-page caching enabled out of the box). After that, a caching + optimization plugin (WP Rocket, Perfmatters, or LiteSpeed Cache) handles preloading, CSS/JS deferral, and image lazy loading toggling in one place. The key mistake to avoid: enabling lazy loading for ALL images via the plugin, then not excluding the LCP hero image from lazy loading. Every performance plugin that supports lazy loading has an exclusion field — use it for your hero image src or CSS class.
- Shopify: Shopify hosts all stores on its own CDN, so TTFB and server-side performance are mostly handled. The CWV issues on Shopify are overwhelmingly caused by: (a) theme JavaScript that is loaded on every page regardless of relevance, (b) app scripts from third-party Shopify apps that load synchronously, and (c) hero banner images that are oversized or not preloaded. Review app scripts in your Shopify theme's layout/theme.liquid file and identify scripts that can be loaded conditionally or deferred. See our technical SEO guide for Shopify stores for platform-specific detail.
- Custom / React / Next.js sites: JavaScript-rendered content is the primary LCP challenge because the browser must download, parse, and execute JS before rendering the LCP element. Use Server-Side Rendering (SSR) or Static Site Generation (SSG) for content-heavy pages. Next.js Image component handles preloading and size attributes automatically — use it instead of native <img> tags. For INP, React's concurrent rendering features (useDeferredValue, startTransition) allow you to defer non-urgent state updates so the main thread stays responsive to user input. This is a developer-level change — see our JavaScript SEO audit guide for more on how rendering choices affect both CWV and crawlability.
Validating Fixes and Managing the 28-Day Wait
There is a common source of confusion after deploying Core Web Vitals fixes: PageSpeed Insights improves immediately (it uses lab data), but Google Search Console takes up to 28 days to update (it uses field data from real Chrome users). Both are showing you real information — they are just measuring different things.
Do not judge your fix by PageSpeed Insights alone and then wonder why Search Console still shows 'Poor' three days later. The field data window needs to accumulate enough post-fix measurements before the status changes.
- Immediate validation (lab data): Run the fixed URL in PageSpeed Insights immediately after deploying. Look at Mobile tab. If LCP, CLS, and INP scores all show green, the technical fix is in place.
- Real User Monitoring (RUM): For faster feedback than waiting for GSC, set up the web-vitals JavaScript library (available from Google) to send CWV measurements to your analytics. This gives you real user data within hours of the fix going live rather than weeks.
- Search Console validation trigger: In Search Console → Core Web Vitals → click into the failing URL group → 'Validate Fix.' This starts a formal validation process. GSC will monitor the group and update status once enough data confirms improvement. The validation can take 28 days.
- Watch for regressions: After fixing CWV, set a monthly reminder to re-check the GSC Core Web Vitals report. Plugin updates, new ad scripts, and theme changes regularly re-introduce CWV failures. A single new chat widget or a theme update that disables your hero image preload can move you back to 'Poor' without any obvious sign.
- Check mobile and desktop separately: A fix that resolves CLS on desktop may not fully address it on mobile if the mobile layout uses different image sizes or a different template. Always validate both device tabs in GSC after deploying fixes.
Developer Handoff Notes: What to Ask For and How to Scope the Work
If you are a business owner handing these fixes to a developer or agency, the conversation is more productive when you come with specific diagnostics rather than 'make my site faster.' Here is how to frame the work.
- Share the PageSpeed Insights URL directly. Send your developer the PageSpeed Insights report URL for the specific failing page — it contains the full audit with identified issues, not just a score. The URL format is: https://pagespeed.web.dev/report?url=YOUR-PAGE-URL
- Separate the fix list by risk level. Share this article's fix sequences and ask the developer to categorize each item as Low / Medium / High risk before touching anything. Low-risk fixes (image attributes, fetchpriority, lazy loading removal) should be batched and deployed in a single release. High-risk fixes (JS refactoring, render-blocking elimination) should be staged and tested separately.
- Request a staging environment test before production. CSS and JS deferral can break page layout or JavaScript-dependent features. Any fix that touches how or when resources load should be tested on a staging clone before going live.
- Ask for before/after PageSpeed Insights screenshots. This creates a paper trail showing what changed and confirms the developer actually deployed the fix versus just noting it.
- Define 'done' as GSC 'Good' status, not PageSpeed score. Make clear that the success metric is the Core Web Vitals report in Search Console showing 'Good' for the affected URL groups — not a specific PageSpeed number. This aligns the developer's incentive with the actual ranking signal.
- Budget for the 28-day validation cycle. Do not expect to see GSC improvements in one week. A typical project timeline: Week 1 — diagnosis and staging fixes; Week 2 — deploy to production; Weeks 3–6 — GSC field data update and validation.
Core Web Vitals in Context: What They Don't Fix
Core Web Vitals are a real ranking signal, but they are not a magic lever. Fixing them will not rescue a page with thin content, no backlinks, or poor on-page relevance. They work as a tiebreaker within Google's ranking system — they do not override the fundamentals.
If your site is failing CWV and also has indexing problems — pages not showing in Search Console, crawl errors, or noindex tags in the wrong places — fix the indexing issues first. A page that is not indexed cannot benefit from CWV improvements. For a complete picture of technical health beyond CWV, our technical SEO audit checklist for small business websites covers crawlability, indexing, redirects, and schema in a single workflow.
Similarly, if your CWV scores are already in the 'Needs Improvement' range (not 'Poor'), the ranking benefit of pushing into 'Good' is smaller than the benefit of improving content quality, earning more local citations, or building topical authority. Prioritize accordingly. CWV fixes have their highest leverage when: (a) you are currently in the 'Poor' category, (b) your competitors are in 'Good,' and (c) your content and link signals are otherwise competitive.
For local businesses specifically, note that Core Web Vitals affect both organic blue-link results and the page experience signals that factor into how Google evaluates your landing page quality. If you are running Google Ads alongside organic SEO, a slow landing page also directly increases your Cost Per Click by lowering your Quality Score. The same CWV fixes improve both channels.
FAQs
How long does it take for Core Web Vitals fixes to show up in Google Search Console?
Up to 28 days. Google Search Console uses field data — real measurements from Chrome users — which accumulates over a rolling 28-day window. After deploying a fix, trigger a 'Validate Fix' in the affected URL group in GSC. You can confirm the fix is working immediately using PageSpeed Insights (lab data), but the GSC status change takes weeks of real user data to register.
My PageSpeed Insights score is 90+ but I'm still failing Core Web Vitals in Search Console. Why?
PageSpeed Insights lab data simulates a page load under controlled conditions. Search Console field data reflects your actual visitors on real devices and connections — including older mobile phones on slower networks. If your real users are predominantly on mid-range Android devices on 4G, their experience will be measurably slower than what Insights simulates on a modern desktop connection. The 75th percentile threshold means 25% of your slowest real-world page loads are what determines your status — not the median or the lab result.
Which Core Web Vital should I fix first?
Fix LCP first in almost every case. LCP is the metric with the highest failure rate on small business sites, and it has the clearest, most impactful fixes available (preloading the hero image, removing lazy loading from above-the-fold images, improving TTFB). CLS is typically fastest to fix once diagnosed. INP is the most complex and usually requires developer involvement. Start with whatever GSC shows as 'Poor' — a URL group's status is set by its worst-performing metric.
Does failing Core Web Vitals directly hurt my Google rankings?
Yes, but with nuance. Core Web Vitals are a confirmed ranking signal, functioning primarily as a tiebreaker when two pages have similar relevance and authority. For competitive local searches where the top results are closely matched on content quality, CWV performance can determine who ranks in positions 1–3 versus 4–7. The impact is less decisive when there are large relevance or authority gaps between competing pages.
Can I fix Core Web Vitals without a developer?
Some fixes, yes. On WordPress, a performance plugin like WP Rocket or LiteSpeed Cache handles image lazy loading exclusions, JavaScript deferral, and preloading through a settings interface — no code required. Converting images to WebP via a plugin like ShortPixel is also non-technical. However, fixes involving fetchpriority attributes, custom font preloading, code-splitting long JavaScript tasks, or adjusting how third-party scripts load typically require developer access to theme files or source code.
How do I know which element is causing my LCP to fail?
Run the failing URL in PageSpeed Insights and look under the 'Diagnostics' section for 'Largest Contentful Paint element' — it names the specific element (usually an image src or a heading tag). Chrome DevTools also highlights the LCP element: open DevTools → Performance tab → record a page load → look for the LCP marker in the timeline, then click it to see the associated element.
My site uses a page builder (Elementor, Divi, etc.). Is that why my CWV are failing?
Page builders are a contributing factor, not always the sole cause. They tend to generate large amounts of CSS loaded site-wide regardless of what's on the page, and they often add inline JavaScript that runs on every page load. The most impactful mitigation without abandoning the builder is: (1) use a performance-focused child theme, (2) enable CSS/JS deferral in a caching plugin, (3) exclude the LCP image from lazy loading, and (4) audit which elements on each page are actually using the builder's scripts. Some builders (GeneratePress, Kadence) produce significantly lighter output than others (Elementor's default configuration).
Should I use a CDN to fix Core Web Vitals?
A CDN primarily helps LCP by reducing the distance between your server and the user, which lowers TTFB and speeds up image delivery. If your TTFB is above 600ms and your visitors are geographically distributed, a CDN with edge caching (Cloudflare, BunnyCDN, Fastly) is a high-value fix. However, if your TTFB is already under 400ms and your LCP image is large and unoptimized, converting the image format and adding fetchpriority will deliver more improvement than adding a CDN alone.
Related reading
- core web vitals seo — Core Web Vitals for SEO: What Business Owners Need to Fix First
- crawl budget seo — Crawl Budget SEO: Why Google Skips Pages on Small Business Sites (and How to Fix It)
- technical seo audit checklist — Technical SEO Audit Checklist for Small Business Websites
- what is a technical seo audit — What Is a Technical SEO Audit? The 7 Areas That Actually Determine Whether Google Can Rank Your Site
- google business profile audit — Google Business Profile Audit Checklist: 23 Things That Actually Affect Your Local Ranking
- turboquant entity driven seo — Google TurboQuant and Entity-Driven SEO: What the Compression Breakthrough Actually Means for Your Site
- openai crawl activity tripled since gpt-5 — OpenAI Crawl Activity Tripled Since GPT-5: What It Means for Your Website
- AI crawler blocking strategy — The AI Crawler Protection Paradox: Why Brands Block Bots Then Pay to Be Seen
- home services seo — Home Services SEO Benchmark: What It Actually Takes to Rank in the Top 3 in 2026
- seo news — Tracking Parameters in Internal Links Are Hurting Your SEO — Here's How to Fix Them
Research notes
Background claims used while researching this article. Verify with the cited authorities before quoting.
- Google's official threshold values for LCP (2.5s good / 4.0s poor), CLS (0.1 good / 0.25 poor), and INP (200ms good / 500ms poor)
- INP replaced FID as a Core Web Vital in March 2024
- Pages with more than ~1,400 DOM nodes cause measurable interaction latency increases
Marcus Chen
Head of Technical SEO · Findvex
Marcus Chen heads technical SEO at Findvex. He writes about Core Web Vitals, indexing, schema, and JavaScript SEO — translating Google’s documentation into checklists small business owners can actually act on.
Expertise: Core Web Vitals · Indexing & crawlability · Schema / structured data · JavaScript SEO
Related reads
Google TurboQuant and Entity-Driven SEO: What the Compression Breakthrough Actually Means for Your Site
TurboQuant is a vector quantization algorithm from Google Research that dramatically compresses the mathematical representations AI uses to understand meaning. If it reaches production search infrastructure, it could lower the cost of semantic retrieval at scale — making entity-based content signals more dominant and keyword-match signals relatively less important.
SEO NewsHow AI Is Changing Local Search Visibility: What the SOCi + Google Webinar Revealed
Google and SOCi's joint webinar on local search visibility highlighted a fundamental shift: AI-powered discovery across Google Search, Maps, and Gemini now requires a different optimization playbook than the one most small businesses are running. Here's what changed and what to prioritize.
Strategic Technical SEODuplicate Content SEO: What Google Actually Penalizes vs. What It Silently Handles
Duplicate content rarely triggers a manual penalty. Google usually picks one version and ignores the rest. But the wrong choice by Google can split your ranking signals, waste crawl budget, and suppress pages you actually want ranked. Here's how to diagnose the difference.