Core Web Vitals for SEO: What Business Owners Need to Fix First
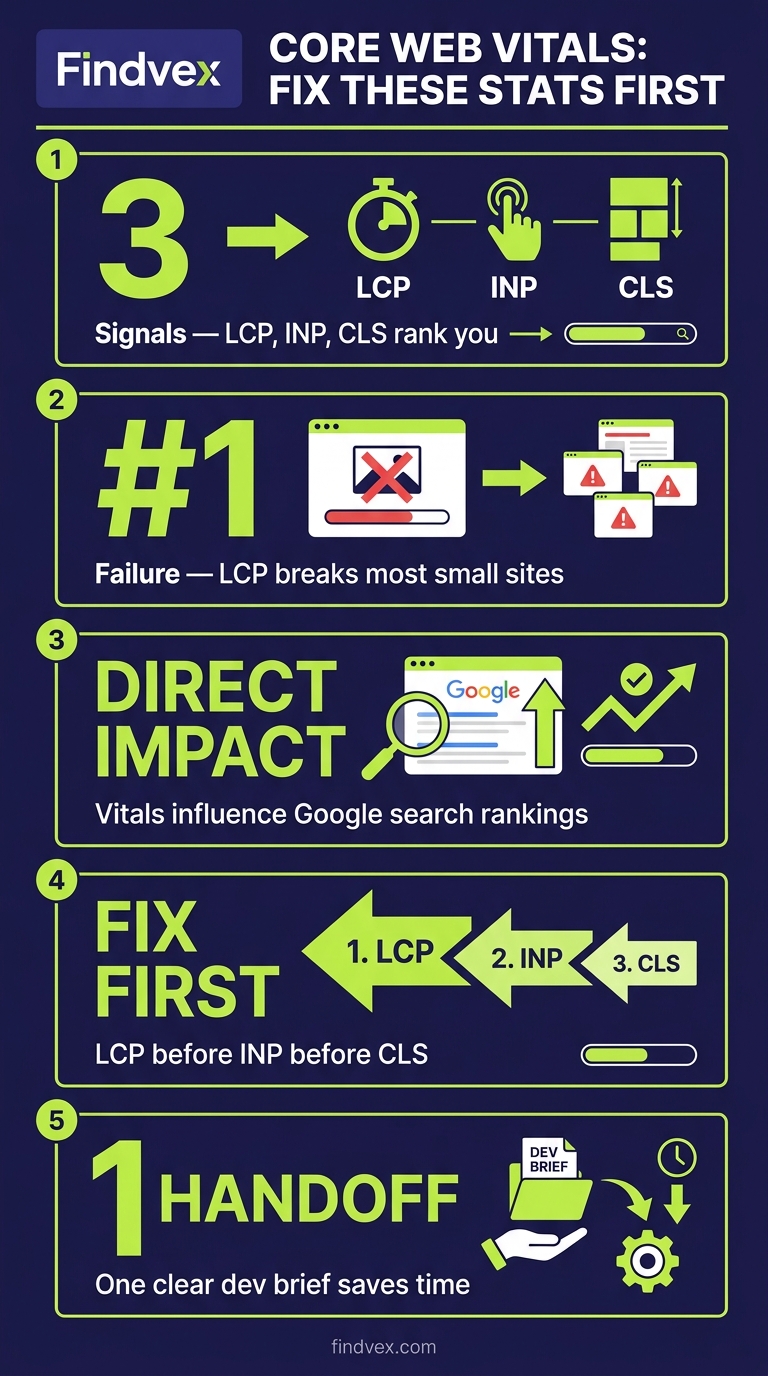
Core Web Vitals are Google's three page experience signals—LCP, INP, and CLS—that directly influence search rankings. Most small business sites fail on LCP first. This guide shows you how to diagnose each metric, prioritize your fixes, and hand off the right tasks to your developer without wasting time on low-impact changes.
Quick answer
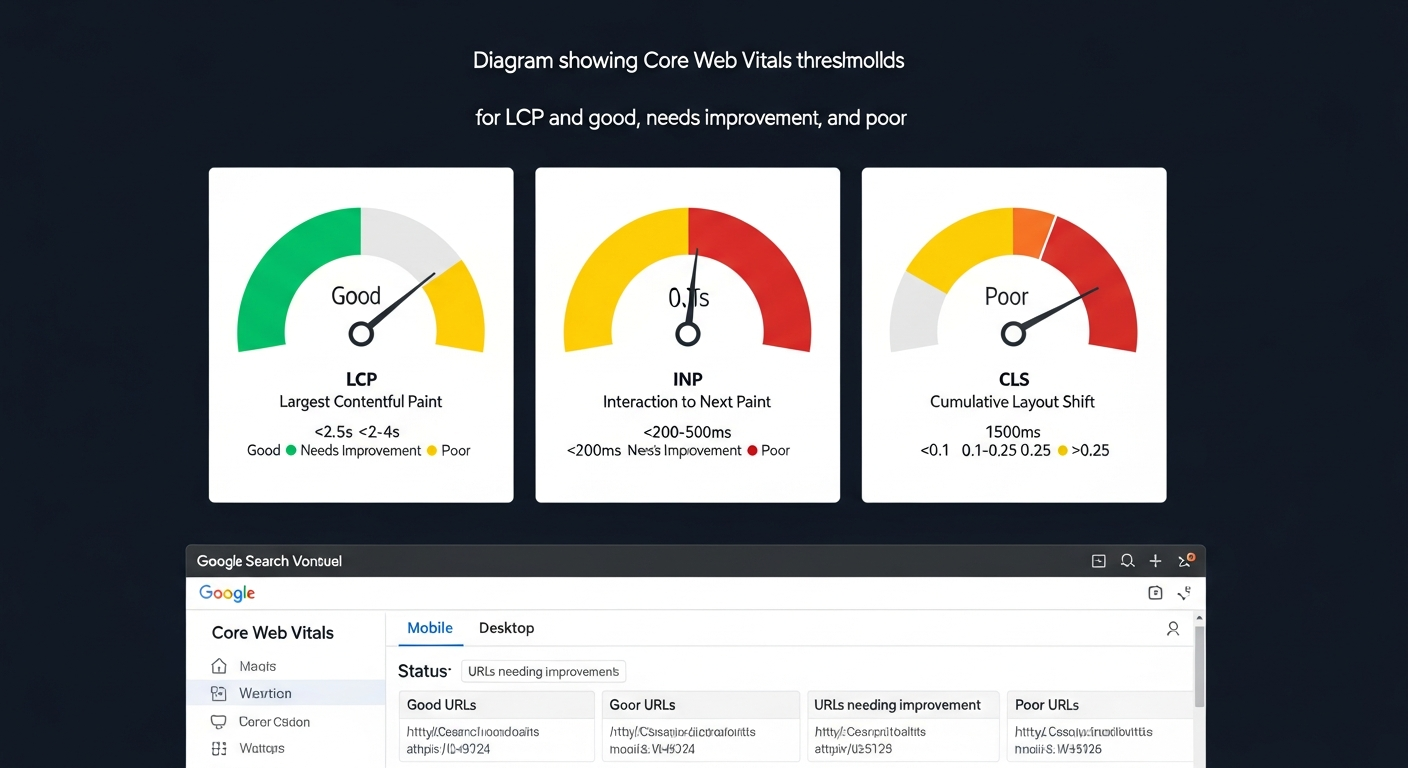
Core Web Vitals are three Google ranking signals: Largest Contentful Paint (LCP, target under 2.5s), Interaction to Next Paint (INP, target under 200ms), and Cumulative Layout Shift (CLS, target under 0.1). For most small business websites, the highest-impact fix is LCP—usually caused by an unoptimized hero image or slow server response. Start in Google Search Console > Core Web Vitals report to see which pages are failing and which metric is the cause, then prioritize LCP before INP or CLS.
What Core Web Vitals Actually Measure (and Why They Affect Rankings)
Core Web Vitals are a set of three field metrics Google uses to measure real-user page experience. Unlike lab scores from tools like Lighthouse, these are based on actual Chrome user data collected through the Chrome User Experience Report (CrUX). That distinction matters: a page can score 90 in Lighthouse and still fail Core Web Vitals if real users on slower connections are having a poor experience.
Google confirmed Core Web Vitals as a ranking signal as part of its Page Experience update. They are not the dominant ranking factor—content relevance and authority still carry more weight—but for pages competing closely on content quality, a poor Core Web Vitals score can be a tiebreaker that costs you a top-three position.
The three metrics are distinct problems with distinct causes and distinct fixes. Treating them as one 'speed problem' is the most common mistake business owners make when handed a performance report.
- LCP (Largest Contentful Paint): How long it takes for the largest visible element—usually a hero image or H1—to load. Target: under 2.5 seconds.
- INP (Interaction to Next Paint): How quickly the page responds after a user clicks, taps, or types. Replaced FID in March 2024. Target: under 200ms.
- CLS (Cumulative Layout Shift): How much the page layout jumps around while loading. A score above 0.1 means elements are visibly shifting and disrupting users. Target: under 0.1.
Core Web Vitals Diagnosis Checklist
Before touching any code, spend 20 minutes gathering data. Fixing the wrong thing first is expensive and demoralizing. Work through this checklist in order.
- Step 1 — Check field data first. Open Google Search Console > Experience > Core Web Vitals. If you have fewer than 1,000 monthly visitors, CrUX may not have enough data to report field metrics for your site. In that case, use PageSpeed Insights (pagespeed.web.dev) and look at the CrUX data section at the top before the Lighthouse scores.
- Step 2 — Identify which pages are failing. The GSC report groups pages into 'Poor,' 'Needs Improvement,' and 'Good.' Click into each group to see the specific URLs. Prioritize your highest-traffic pages and any pages that drive leads or sales.
- Step 3 — Identify which metric is causing the failure. A page can fail on LCP, INP, or CLS independently. Clicking a URL cluster in GSC shows you the contributing metric. Don't assume it's the same one across all pages.
- Step 4 — Run PageSpeed Insights on a failing page. This gives you the lab diagnostic data—Opportunities and Diagnostics sections—that tells you why the metric is failing, not just that it is.
- Step 5 — Check mobile vs. desktop separately. GSC reports Core Web Vitals by device type. Mobile almost always fails first. Confirm which device is driving the failure before prescribing fixes.
- Step 6 — Note your server response time (TTFB). In PageSpeed Insights, look for 'Reduce initial server response time.' A TTFB over 600ms is a root cause that undermines all three metrics simultaneously. Fix hosting or add a CDN before optimizing images or scripts.
- Step 7 — List your LCP element. PageSpeed Insights identifies the specific LCP element in the diagnostics. It's usually a hero image, a background CSS image, or a large H1. Knowing the exact element prevents you from optimizing the wrong asset.
“AI agents do in hours what teams used to do in weeks. The advantage compounds.”
LCP: The Metric Most Small Business Sites Fail—and How to Fix It
LCP is where most small business websites fail first, and it's usually the highest-ROI fix. A slow-loading hero image or a server that takes over a second to respond will blow your LCP score regardless of anything else you optimize.
The three most common causes on small business sites, in order of frequency:
- Unoptimized hero image: A 2MB+ JPEG loaded as the page's largest element. Fix: Compress to WebP or AVIF format, size it to the actual display dimensions (don't serve a 2400px image in a 800px container), and add
fetchpriority="high"to the<img>tag so the browser loads it before other resources. Risk level: Low. A developer or even a technically capable site owner can handle this on most CMS platforms. - Slow server response time (TTFB): Shared hosting with a TTFB over 800ms will cap your LCP before you've done anything else. Fix: Move to a faster hosting tier, add a CDN (Cloudflare's free tier often drops TTFB substantially), or implement server-side caching. Risk level: Medium. Hosting migrations carry some risk; test on a staging environment first.
- LCP element loaded via CSS background-image: Google's crawler and browser cannot preload CSS background images the same way it can
<img>elements. If your hero is a CSS background, converting it to an HTML<img>with propersrcsetandfetchpriorityis the fix. Risk level: Medium. Requires a developer if you're not comfortable with HTML/CSS. - Render-blocking resources: Large CSS or JavaScript files that block the browser from rendering content. Fix: Defer non-critical JS, inline critical CSS, and remove unused CSS. Risk level: Medium-High. Deferring the wrong scripts can break functionality. Developer should own this.
INP: Why Your Page Feels Sluggish Even After It Loads
INP replaced First Input Delay (FID) in March 2024 and is harder to diagnose because it measures responsiveness throughout the entire page session, not just the first interaction. A page can load quickly and still fail INP if clicking a menu or submitting a form takes more than 200ms to visually respond.
INP failures are almost always JavaScript problems. The most common cause on small business sites is third-party scripts—chat widgets, marketing pixels, cookie consent tools—executing heavy tasks on the main thread and blocking user interactions.
- Symptom: Page loads fine but feels 'sticky' or laggy when you click buttons, open dropdowns, or interact with forms.
- Primary cause: Long tasks on the main thread, usually from third-party JavaScript (chat widgets, tag managers loading multiple pixels, heavy analytics libraries).
- Fix 1 — Audit your third-party scripts. In Chrome DevTools > Performance tab, record an interaction and look for long tasks (red blocks over 50ms). Identify which scripts own those tasks. Removing or lazy-loading non-essential scripts is the highest-impact INP fix on most small business sites.
- Fix 2 — Defer non-critical JavaScript. Scripts that don't need to run on page load should use the
deferorasyncattribute. Google Tag Manager loading ten marketing pixels synchronously is a common culprit. - Fix 3 — Break up long tasks. If your own JavaScript runs long tasks, a developer can use
setTimeoutor the Scheduler API to break work into smaller chunks, yielding control back to the browser between them. Risk level: High. This is a developer task requiring testing. - Fix 4 — Check your CMS plugins. On WordPress, page builder plugins (Elementor, Divi, WPBakery) often inject substantial JS that inflates INP. A developer can selectively disable plugin scripts on pages where they're not needed using conditional loading.
CLS: Stopping Layout Shifts That Frustrate Users and Hurt Rankings
CLS is the most visually disruptive metric—users see buttons and text jumping around as the page loads. It's also often the easiest metric to fix once you know the cause. Unlike LCP and INP, many CLS fixes don't require a developer.
The most common CLS causes on small business sites:
- Images without explicit width and height attributes: When the browser doesn't know an image's dimensions before it loads, it reserves no space for it. When the image loads, everything below it shifts down. Fix: Add
widthandheightattributes to all<img>tags. Modern browsers use these to calculate aspect ratio and reserve the correct space. Risk level: Low. - Web fonts causing FOUT (Flash of Unstyled Text): When a custom font loads late, text reflows as the font metrics differ from the fallback. Fix: Add
font-display: optionalorfont-display: swapwith a closely matched fallback font stack, and preload critical fonts with<link rel="preload">. Risk level: Low-Medium. - Ads, embeds, and iframes without reserved space: Ad slots that load dynamically push content down. Fix: Reserve the space for ad containers with a fixed minimum height in CSS even before the ad loads. Risk level: Low.
- Dynamically injected content above the fold: Cookie banners, notification bars, or promotional banners injected via JavaScript that push page content down. Fix: Reserve space for these elements or inject them below the fold. Risk level: Low-Medium.
- Animations using top/left/margin instead of transform: CSS animations that change layout properties trigger reflows. Fix: Use
transformandopacityfor animations instead, as these run on the compositor thread and don't cause layout shifts. Risk level: Medium.
What to Check in Google Search Console for Core Web Vitals
Google Search Console is your primary source of truth for field data. Here's a focused workflow for business owners and their SEO contacts.
- Core Web Vitals report (Experience > Core Web Vitals): Split by Mobile and Desktop. Start with Mobile. Note the number of 'Poor' URLs and which metric is driving them—GSC groups URLs by their primary failing metric.
- Page Experience report: Confirms whether your pages qualify for the 'good page experience' signal. Check HTTPS status and mobile usability here as well—these are prerequisites.
- URL Inspection tool: For specific pages, run URL Inspection and check the Page Experience section. This confirms whether Google has registered an improvement after you've made fixes. Note: Field data updates on a rolling 28-day window, so fixes won't show immediately.
- Manual validation after fixes: After making and deploying a fix, use the 'Validate Fix' button in the Core Web Vitals report for the relevant URL group. This triggers Google to re-evaluate the pages, though CrUX data still takes 28 days to fully reflect changes.
- Cross-reference with Search Performance report: Filter the Performance report by pages that are failing Core Web Vitals. If those pages have high impressions and low CTR or declining clicks, the page experience issue may be compounding a visibility problem.
How to Prioritize: Fix Order for Maximum SEO Impact
Not every Core Web Vitals fix has the same return. Here's a practical prioritization framework based on impact and effort for a typical small business site.
- Priority 1 — Fix TTFB if over 600ms. Everything downstream depends on server response time. Upgrading hosting or adding a CDN before image optimization is a prerequisite, not an optional extra.
- Priority 2 — Optimize your LCP element. Compress the hero image, convert to WebP, add
fetchpriority="high". This single change moves the needle on LCP faster than almost anything else. Budget: 1-3 hours of developer time. - Priority 3 — Add image dimensions to prevent CLS. A 30-minute task that eliminates the most common source of layout shift. Can often be done in a CMS without developer involvement.
- Priority 4 — Audit and defer third-party scripts. Run Chrome DevTools Performance trace, identify long tasks, and defer or remove low-value scripts. This addresses INP on most small business sites.
- Priority 5 — Reserve space for ads and dynamic content. If you run ads or have notification banners, reserve container space to prevent the CLS they introduce.
- Defer — Advanced JS optimization, render-blocking CSS splits. High effort, high risk, moderate gain. Do these after the above fixes have been validated in GSC.
Developer Handoff Notes: What to Ask For and How to Ask
If you're handing this off to a developer or a web agency, specificity gets results. Vague requests like 'make the site faster' produce inconsistent outcomes. Here's how to frame the ask.
- Provide the PageSpeed Insights URL for the specific page that is failing, not the homepage (unless that's the failing page). Ask the developer to address the items listed under 'Opportunities' in order of estimated savings.
- Name the LCP element explicitly. PageSpeed Insights identifies it. Tell your developer: 'The LCP element on /services is the hero image hero-banner.jpg. Please compress it to WebP, set explicit width and height, and add fetchpriority=high to the img tag.'
- For INP issues: 'Please run a Performance trace in Chrome DevTools and identify any long tasks over 200ms. Specifically check whether the live chat widget and Google Tag Manager are contributing to main thread blocking.'
- For CLS issues: 'Please add explicit width and height attributes to all img elements on these pages. Also check whether the cookie consent banner is causing layout shift by injecting above the fold.'
- Request a before/after PageSpeed Insights screenshot for the specific pages. This is your baseline for verifying the fix worked before the 28-day CrUX window updates GSC.
- Ask for changes on a staging environment first, especially for render-blocking script changes. Deferring the wrong JS file can break checkout flows, contact forms, or tracking.
Core Web Vitals as Part of a Broader Technical SEO Foundation
Core Web Vitals are one layer of your technical SEO foundation, not the whole thing. Pages that load quickly but can't be crawled or indexed won't rank regardless of their performance scores. If you haven't already worked through a structured technical audit, the findings there will tell you whether Core Web Vitals should be your first priority or whether crawlability and indexing issues need addressing first.
Our technical SEO audit checklist for small business websites walks through crawlability, indexing, robots.txt, and sitemap issues in addition to performance—useful context if you're starting a broader audit rather than targeting Core Web Vitals specifically.
FAQs
Do Core Web Vitals directly affect Google rankings?
Yes, but they are one signal among many. Google uses Core Web Vitals as part of its page experience ranking signals. For most queries, content quality and relevance still outweigh performance scores. However, on competitive SERPs where multiple pages have similar content quality, strong Core Web Vitals can be the tiebreaker that earns a higher position or a featured snippet placement.
My PageSpeed Insights score is 90 but Google Search Console shows poor Core Web Vitals. Why?
PageSpeed Insights lab scores and Core Web Vitals field data measure different things. The lab score is a simulated test under controlled conditions. Core Web Vitals in GSC use real Chrome user data (CrUX), which reflects actual user devices, connections, and geographic locations. A page can score well in the lab but fail in the field if your real users are on slower mobile connections. Always prioritize the field data over the lab score.
How long does it take for Core Web Vitals improvements to show up in Google Search Console?
CrUX data is collected on a rolling 28-day window. This means fixes you deploy today will take up to 28 days to fully appear in the GSC Core Web Vitals report. You can verify technical fixes immediately using PageSpeed Insights (lab data), but field data confirmation takes time. Use the 'Validate Fix' feature in GSC to signal to Google that you've made changes to a URL group.
What replaced First Input Delay (FID) in Core Web Vitals?
Interaction to Next Paint (INP) replaced FID as an official Core Web Vital in March 2024. FID only measured the delay before the browser responded to the first user interaction. INP measures responsiveness across all interactions throughout the entire page session, making it a more comprehensive measure of real interactivity. If you have old audit reports referencing FID, those recommendations may still be partially valid but need to be re-evaluated against INP.
Can I fix Core Web Vitals without a developer?
Some fixes, yes. Adding explicit width and height to images in your CMS, converting images to WebP using a plugin (on WordPress, tools like ShortPixel or Imagify handle this without code), and adjusting which fonts load first can often be done without developer access. However, fixes for INP (JavaScript optimization), render-blocking resources, and server response time typically require developer involvement. Attempting render-blocking script changes without technical knowledge risks breaking site functionality.
Does Core Web Vitals apply to mobile and desktop separately?
Yes. Google Search Console reports Core Web Vitals separately for mobile and desktop. Google's ranking signals predominantly use mobile data since Google moved to mobile-first indexing. Your mobile Core Web Vitals are the priority. It's common for desktop scores to be 'Good' while mobile scores remain 'Poor'—both need addressing, but mobile should come first.
What is a good LCP score for SEO purposes?
Google's threshold for a 'Good' LCP score is 2.5 seconds or faster, measured at the 75th percentile of page loads (meaning 75% of your users experience LCP within that time). Between 2.5 and 4.0 seconds is 'Needs Improvement.' Above 4.0 seconds is 'Poor.' For competitive local service pages, aiming for under 2.0 seconds on mobile gives you a buffer above the threshold and a better user experience.
Related reading
- google business profile audit — Google Business Profile Audit Checklist: 23 Things That Actually Affect Your Local Ranking
- page speed seo — Page Speed SEO: The Metrics, Tools, and Fixes That Actually Move Rankings
- page speed optimization — Page Speed Optimization for Small Business Websites: The Diagnostic Sequence That Fixes the Right Things First
- what is a technical seo audit — What Is a Technical SEO Audit? The 7 Areas That Actually Determine Whether Google Can Rank Your Site
- how to fix core web vitals — How to Fix Core Web Vitals: The Sequence That Gets Small Business Sites to 'Good' Fastest
- inp core web vital — INP Core Web Vital: What It Measures, Why It Replaced FID, and How to Fix It on Small Business Sites
- technical seo audit checklist — Technical SEO Audit Checklist for Small Business Websites
- crawl budget seo — Crawl Budget SEO: Why Google Skips Pages on Small Business Sites (and How to Fix It)
- home services seo — Home Services SEO Benchmark: What It Actually Takes to Rank in the Top 3 in 2026
- mobile seo — Mobile SEO for Service Businesses: 7 Technical Reasons Your Site Ranks Lower on Phones (and How to Fix Each One)
Research notes
Background claims used while researching this article. Verify with the cited authorities before quoting.
- Google confirmed Core Web Vitals as a ranking signal as part of its Page Experience update — verify via Google Search Central official documentation confirming Page Experience ranking signal and Core Web Vitals inclusion. URL: https://developers.google.com/search/docs/appearance/page-experience — editor should verify this URL resolves and cite it directly.
- INP replaced FID as an official Core Web Vital in March 2024 — verify via Google Search Central blog post announcing the FID-to-INP transition. Editor should locate the specific announcement post on developers.google.com/search/blog and add as a citation.
- CrUX data is collected on a rolling 28-day window — verify via Google Chrome UX Report documentation or Google Search Console help documentation confirming the 28-day rolling window. Editor to verify and cite.
Marcus Chen
Head of Technical SEO · Findvex
Marcus Chen heads technical SEO at Findvex. He writes about Core Web Vitals, indexing, schema, and JavaScript SEO — translating Google’s documentation into checklists small business owners can actually act on.
Expertise: Core Web Vitals · Indexing & crawlability · Schema / structured data · JavaScript SEO
Related reads
Answer Engine Optimization (AEO): The 2026 Guide for Small Businesses
Learn answer engine optimization (AEO) in 2026. This practical guide helps small businesses get found in AI search, voice assistants, and answer engines.
SEOGenerative Engine Optimization (GEO): The 2026 Guide for Small Businesses
Learn how generative engine optimization helps small businesses get found in AI search. Our 2026 GEO guide covers strategies, tactics, and tips to boost visibility.
SEOSEO Agency in USA: AI-Powered SEO for Small Businesses | Findvex
Findvex is a leading SEO agency in USA delivering AI-powered SEO strategies that help small businesses rank higher, drive traffic, and grow revenue. Get started today.