Page Speed SEO: The Metrics, Tools, and Fixes That Actually Move Rankings
Page speed affects SEO through Core Web Vitals—specifically LCP, INP, and CLS. This guide explains which metrics Google actually measures, how to read PageSpeed Insights and GTmetrix without confusion, and the ordered sequence of fixes that move rankings fastest on small business sites.
Quick answer
Page speed affects SEO through three Core Web Vitals: Largest Contentful Paint (LCP), Interaction to Next Paint (INP), and Cumulative Layout Shift (CLS). Google uses field data from the Chrome User Experience Report—not lab scores—as a ranking signal. To improve rankings, run PageSpeed Insights to identify your real-world CWV status, then fix LCP first (usually images and render-blocking resources), followed by INP (JavaScript execution), then CLS (unstable layout elements). A PageSpeed score of 100 is not the goal; 'Good' status on all three CWV metrics is.
Page Speed and SEO: What Google Actually Measures
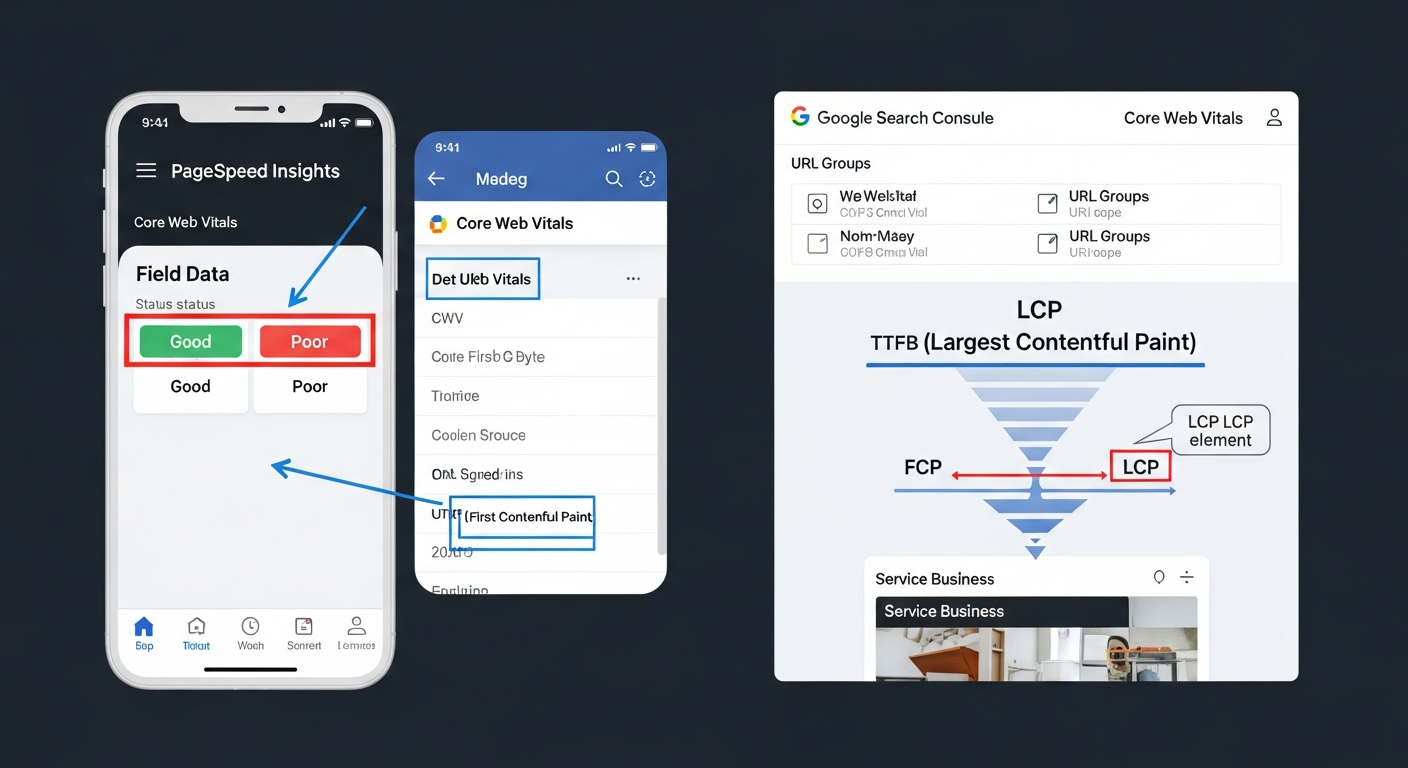
Page speed does affect Google rankings—but not in the way most tools make it look. Google does not rank your site based on your PageSpeed Insights score. It ranks based on Core Web Vitals: three specific, user-facing metrics measured in real-world conditions using data from actual Chrome users. If your CWV data is thin (not enough real users), Google falls back to lab data, but field data always takes precedence when available.
This distinction matters because chasing a high lab score and fixing what actually moves your rankings are often different activities. A site can score 45 in PageSpeed Insights and have 'Good' CWV status in Google Search Console. A site can score 92 and still fail CWV thresholds. The score is a diagnostic tool, not the output Google measures.
The three signals that matter are: Largest Contentful Paint (LCP)—how quickly the main content loads; Interaction to Next Paint (INP)—how fast the page responds when a user clicks or taps; and Cumulative Layout Shift (CLS)—how much content jumps around during load. Each has a 'Good,' 'Needs Improvement,' and 'Poor' threshold. Ranking benefit comes from reaching 'Good' on all three, not from incremental improvements within the 'Poor' band.
The Three Core Web Vitals: Thresholds and Business Impact
Understanding the specific thresholds helps you prioritize correctly. Google evaluates CWV at the 75th percentile of field data—meaning 75% of your real visitors need to experience 'Good' performance, not just the average.
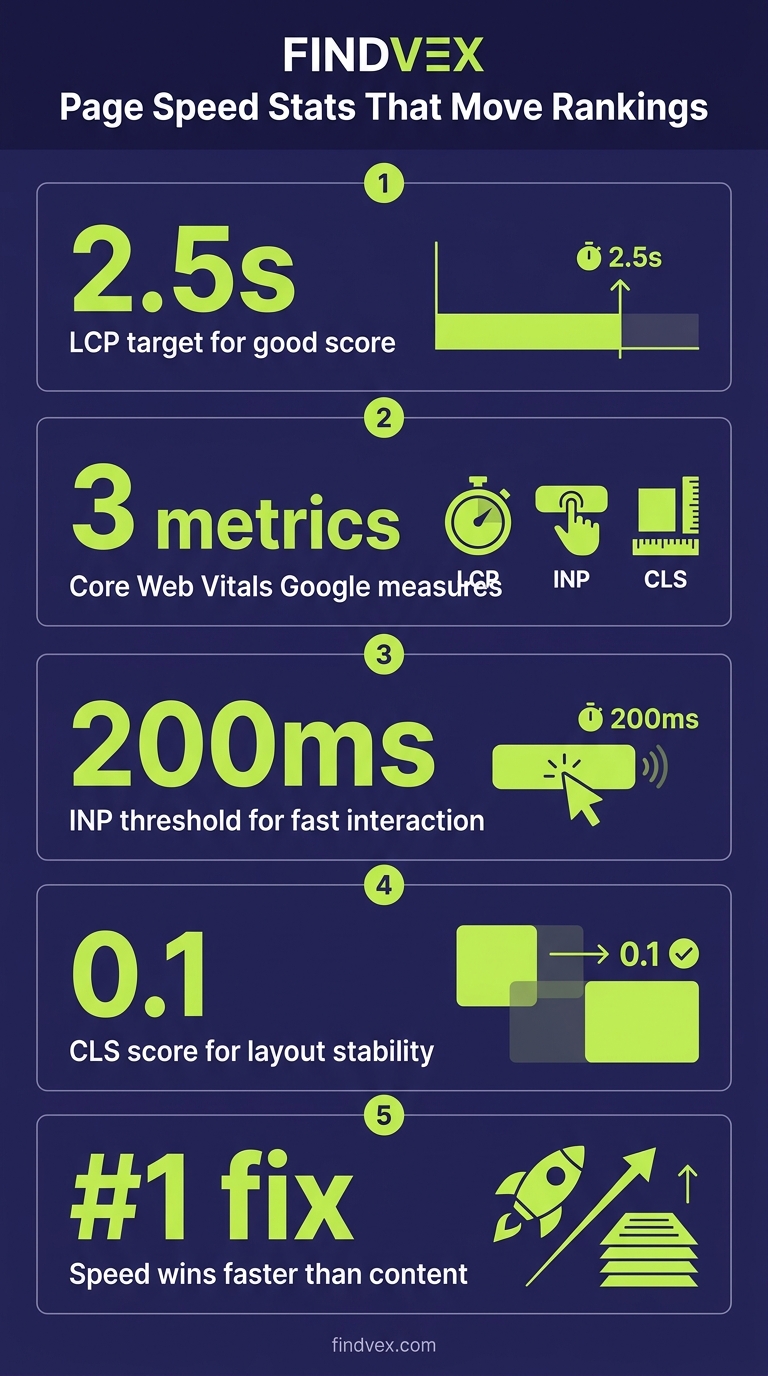
LCP measures the render time of the largest visible element—usually a hero image, above-the-fold text block, or video poster. 'Good' is under 2.5 seconds. 'Needs Improvement' is 2.5–4.0 seconds. 'Poor' is over 4.0 seconds. For service businesses where first impressions drive call intent, a slow LCP directly correlates with higher bounce rates on mobile.
INP replaced FID (First Input Delay) in March 2024. It measures the full interaction latency—from user input to the next visual frame. 'Good' is under 200ms. 'Needs Improvement' is 200–500ms. 'Poor' exceeds 500ms. INP failures are almost always caused by heavy JavaScript execution on the main thread—third-party scripts, chat widgets, and analytics tags are the usual suspects.
CLS measures unexpected visual movement. 'Good' is a score under 0.1. Common causes on small business sites: images without explicit width/height attributes, fonts that swap in after load, and late-loading ads or embeds that push content down. CLS is the most fixable of the three, often requiring only HTML attribute changes rather than server work.
- LCP Good: < 2.5s | Needs Improvement: 2.5–4.0s | Poor: > 4.0s
- INP Good: < 200ms | Needs Improvement: 200–500ms | Poor: > 500ms
- CLS Good: < 0.1 | Needs Improvement: 0.1–0.25 | Poor: > 0.25
- All three evaluated at the 75th percentile of real user data
- Field data (Chrome UX Report) overrides lab data when available
“AI agents do in hours what teams used to do in weeks. The advantage compounds.”
PageSpeed Insights vs. GTmetrix vs. Search Console: Which Tool to Use and When
Three tools dominate page speed diagnostics, and each answers a different question. Using the wrong tool for the wrong job produces misleading conclusions.
PageSpeed Insights (PSI) is the right starting point because it shows both field data (from the Chrome UX Report) and lab data (from Lighthouse) in a single view. When you open PSI and see the 'Discover what your real users are experiencing' section, that's your actual ranking signal. The Lighthouse score below it is a diagnostic aid. PSI is free, requires no account, and reflects Google's own measurement infrastructure. Run it on your homepage, your highest-traffic service page, and your slowest page according to Search Console.
GTmetrix uses its own lab environment (WebPageTest under the hood) and reports metrics including LCP, TBT (Total Blocking Time), and CLS alongside a waterfall chart. GTmetrix excels at diagnosing which specific resources are causing bottlenecks—its waterfall view shows you exactly which requests delay LCP and in what order. It does not show your real-user CWV data. Use GTmetrix after PSI tells you what the problem category is, to identify the exact resource causing it.
Google Search Console's Core Web Vitals report is the authoritative source for your ranking-relevant data. It aggregates field data across all pages grouped into URL groups, shows you the count of 'Good,' 'Needs Improvement,' and 'Poor' URLs, and flags specific page groups that are failing. This is where you confirm whether fixes have moved the needle—CWV improvements take 28 days to reflect in Search Console after real users experience the change. If you have fewer than a few hundred monthly visits, you may not have enough field data for CWV to appear here at all, in which case Google uses lab data.
- PageSpeed Insights → shows real-user CWV data + Lighthouse diagnostics in one place; use first
- GTmetrix → detailed waterfall analysis, resource-level diagnostics; use to pinpoint specific slow requests
- Google Search Console → authoritative field data for ranking purposes; use to confirm fixes worked
- WebPageTest.org → advanced testing, multi-step flows, filmstrip view; use for deep audits
- Chrome DevTools Performance tab → local debugging, trace-level detail; use when others can't isolate root cause
Diagnosis Checklist: Find Your Biggest Speed Problem in 15 Minutes
Before touching any code or settings, run this diagnostic sequence. Skipping straight to fixes without diagnosis is how businesses spend money on caching plugins while their real problem is a 2MB uncompressed hero image.
- Step 1 — Open PageSpeed Insights (pagespeed.web.dev) and test your homepage on mobile. Note your field data LCP, INP, and CLS status (Good / NI / Poor).
- Step 2 — If field data is unavailable, look at the Lighthouse lab scores. Note the top 3 Opportunities and Diagnostics listed.
- Step 3 — Open Google Search Console → Experience → Core Web Vitals. Check how many URLs are flagged Poor or Needs Improvement. Click into the issue to see which page groups are affected.
- Step 4 — Run the failing page type in GTmetrix. Open the Waterfall tab. Find the request that starts latest or takes the longest before LCP fires.
- Step 5 — Check if the LCP element is an image: right-click → Inspect in Chrome DevTools, look for the largest above-the-fold image. Is it in the HTML or loaded via CSS background-image or JavaScript? CSS/JS-loaded images cannot be preloaded with <link rel='preload'> as effectively.
- Step 6 — Run the URL in Chrome DevTools Performance tab (Shift+Ctrl+E). Look at the 'Long Tasks' section. Any task over 50ms on the main thread is an INP risk.
- Step 7 — Scroll slowly on a slow connection (DevTools → Network → throttle to 'Slow 4G'). If content jumps as you scroll, you have a CLS problem. Note which element moves.
What to Check in Google Search Console
Google Search Console is your ground truth for whether page speed issues are actually affecting your rankings. Here's the specific workflow:
Navigate to Experience → Core Web Vitals. You'll see two reports: Mobile and Desktop. Mobile is the priority—Google uses mobile-first indexing, so mobile CWV scores carry more ranking weight. Click 'Open Report' under Mobile first.
The report groups pages with similar URL patterns together. A URL group like '/services/*' might be flagged as Poor for LCP. This tells you that all service pages share the same underlying issue—often a common template problem rather than a page-specific one. Fix the template, and all grouped URLs improve simultaneously.
After deploying a fix, click 'Validate Fix' in Search Console. Google will then recrawl the affected URLs and check whether real-user data improves over the following 28 days. If validation fails, the report will tell you which specific pages still underperform.
Also check: Experience → Page Experience. This shows the percentage of your URLs with Good Page Experience (passing CWV + HTTPS + no intrusive interstitials). It's a useful site-health metric even if it's not a direct ranking multiplier.
- Experience → Core Web Vitals → Mobile Report: check Poor and Needs Improvement URL groups
- Click into a Poor group to see specific URLs and which metric is failing
- Use 'Validate Fix' after deploying changes—do not expect instant results
- Compare Mobile vs. Desktop reports—mobile failures are the ranking-relevant ones
- If CWV report shows 'Not enough data,' your site likely has low traffic; Google will use lab data for ranking assessment
The Fix Sequence: What to Repair First, Second, and Third
Most sites have multiple speed issues simultaneously. The right order is: fix LCP first (it has the largest ranking impact and often the highest ROI for effort), then INP, then CLS. Each category has a standard diagnostic path and a risk level for the fix.
This sequence assumes you've already identified which metric is failing. If all three are failing, work down the list in order.
Fixing LCP: Images and Render-Blocking Resources
LCP is the most common failure on small business sites. The fix depends on what the LCP element is.
If the LCP element is an image: compress it to WebP format (use Squoosh or ShortPixel), serve it at the exact display dimensions (don't serve a 2000px image in a 600px container), and add fetchpriority='high' to the <img> tag. If your site uses a page builder like Elementor or Divi, this attribute may need to be added via a child theme or custom function. Add a <link rel='preload' as='image'> in the <head> for the LCP image—this instructs the browser to fetch it before it would naturally discover it in the DOM. Risk level: Low. This is HTML attribute work with no functional downside if implemented correctly.
If LCP is delayed by render-blocking JavaScript or CSS: audit which scripts load in the <head> without async or defer attributes. Third-party scripts—Google Tag Manager, chat widgets, review plugins—are common culprits. Adding defer to non-critical scripts moves their execution after HTML parsing, which directly reduces LCP. Risk level: Medium. Some scripts break when deferred (scripts that must run before DOMContentLoaded). Test thoroughly after each change.
If LCP is delayed by a slow server response (Time to First Byte > 800ms): the fix is server-side. Options include switching to a faster hosting tier, enabling server-side caching (WP Super Cache, W3 Total Cache on WordPress), or adding a CDN. Risk level: Low to Medium depending on caching configuration—misconfigured caching can serve stale content.
- Compress hero images to WebP; target under 100KB for above-the-fold images
- Add fetchpriority='high' to the LCP image element
- Preload the LCP image via <link rel='preload' as='image' href='...'> in <head>
- Add defer or async to non-critical <script> tags in <head>
- Reduce Time to First Byte (TTFB) with server-side caching or CDN
- Remove or lazy-load below-the-fold images; never lazy-load the LCP element
Fixing INP: JavaScript Execution and Third-Party Scripts
INP failures are almost always JavaScript problems. The main thread gets blocked by long tasks—large scripts that prevent the browser from responding to user interactions for extended periods.
The diagnostic step: open Chrome DevTools → Performance tab → record a page interaction (click a button, open a menu). Look for red bars in the 'Main' thread—these are long tasks. Hover over them to see which script is responsible.
Common causes on small business sites: Google Tag Manager loading multiple heavy tags simultaneously, live chat widgets (Intercom, Drift, Tidio), Facebook Pixel with conversion tracking, and video embeds that initialize immediately. The fix is to load these scripts only when needed—either by delaying their initialization until after the page is interactive, or by using a tag manager trigger that fires on first user interaction rather than on page load.
If your site runs on WordPress, the Query Monitor plugin can reveal which plugins are adding heavy scripts to the front end. Eliminating or replacing a single resource-heavy plugin sometimes resolves INP failures entirely. Risk level: Medium to High. Delaying analytics and conversion tracking scripts has implications for data accuracy. Coordinate with whoever manages your marketing tracking before making changes.
- Use Chrome DevTools Performance tab to identify which scripts cause long tasks
- Delay non-critical third-party scripts until after page load or first user interaction
- Audit GTM tags—remove unused tags and consolidate firing triggers
- Replace synchronous script loads with async/defer equivalents where possible
- Consider loading chat widgets only after a user scrolls or moves their cursor (interaction-based load)
Fixing CLS: Layout Stability
CLS is the most reliably fixable of the three metrics. The root cause is almost always an element loading after the browser has already painted the page, causing content to shift.
The three most common causes on small business websites: images without explicit width and height attributes (the browser doesn't reserve space for them during layout), web fonts that cause a 'flash of unstyled text' (FOUT) or 'flash of invisible text' (FOIT) as they swap in, and third-party embeds (maps, forms, review widgets) that expand dynamically after load.
Fix images: add explicit width='X' height='Y' attributes to every <img> tag, or use CSS aspect-ratio to reserve space. This single change resolves CLS for a large proportion of sites. Risk level: Very Low—this is a non-functional HTML change.
Fix fonts: use font-display: optional or font-display: swap in your @font-face declarations. optional prevents any font swap; swap swaps quickly but can cause a brief layout shift. For a less noticeable result, preload your primary web font. Risk level: Low.
Fix embeds: wrap third-party iframes (maps, YouTube, review widgets) in a CSS container that reserves fixed dimensions. Without reserved space, these embeds push content down as they load. Risk level: Very Low.
- Add explicit width and height attributes to all <img> tags site-wide
- Use CSS aspect-ratio on image containers if width/height attributes aren't feasible
- Add font-display: swap or font-display: optional to @font-face rules
- Preload the primary web font in <head>
- Wrap third-party iframes in fixed-dimension CSS containers
- Check for late-loading banners or notification bars that push content down
Developer Handoff Notes
If you're passing these fixes to a developer or web agency, the following specifics help avoid back-and-forth. Non-technical business owners should not attempt render-blocking script changes or server-side caching configuration without developer involvement—these carry real risk of breaking site functionality.
Provide the developer with: (1) the PageSpeed Insights URL for each failing page, (2) a screenshot of the failing CWV metrics in Google Search Console including which URL groups are affected, (3) the GTmetrix waterfall for the slowest page, and (4) the specific LCP element identified in Chrome DevTools.
Ask the developer to document every change made and test on a staging environment before pushing to production. CWV changes take 28 days to reflect in Search Console—so clear documentation of the change date is essential for validating impact.
- LCP image optimization: convert to WebP, add fetchpriority='high', add <link rel='preload'>
- Script deferral: add defer attribute to identified non-critical scripts in <head>; test each individually
- Image dimensions: add width/height to all <img> tags or implement CSS aspect-ratio
- Font loading: add font-display: swap/optional to @font-face; preload primary font
- Caching: implement server-side page caching; configure CDN with appropriate cache-control headers
- Staging test: run PSI and GTmetrix on staging URL before deploying; compare scores
- Post-deploy: submit affected URLs for recrawl in GSC → Validate Fix after deployment
Fix Risk Summary: What Requires Developer Oversight
Not all speed fixes carry the same risk. Here's a clear breakdown to help prioritize and assign correctly.
- Very Low Risk (can be done by site owner): Adding width/height to images, compressing images to WebP, submitting sitemap, clicking Validate Fix in Search Console
- Low Risk (developer recommended): Adding fetchpriority and preload to LCP image, adding font-display CSS, wrapping embeds in CSS containers
- Medium Risk (developer required, staging test essential): Adding defer/async to scripts, configuring server-side caching, changing CDN settings
- High Risk (developer required, thorough QA): Removing or replacing third-party scripts, changing server infrastructure, modifying page builder templates
What Doesn't Affect Rankings (Despite Popular Belief)
Several things show up prominently in speed tools but have no direct SEO impact. Chasing them wastes time.
A PageSpeed Insights score below 90 is not a ranking problem on its own. Google does not use the composite Lighthouse score as a ranking signal. What matters is whether your field-data CWV metrics reach 'Good' status.
Desktop speed scores have less ranking weight than mobile. Google's mobile-first indexing means mobile CWV performance is the primary ranking-relevant measurement. A perfect desktop score alongside a poor mobile score is the wrong outcome.
Total page size is not a ranking factor in isolation. A 3MB page that loads in 1.8 seconds (LCP) and has stable layout (CLS < 0.1) is fine. A 1MB page that loads in 4.5 seconds is not. Optimize for the metrics, not the file size.
The number of HTTP requests has diminished in ranking relevance since HTTP/2 and HTTP/3 became widespread. Compressing many small files into one is less critical now than it was in the HTTP/1.1 era. Focus on what PSI specifically flags rather than generic 'minimize requests' advice.
WordPress-Specific Speed Fixes Small Business Sites Actually Need
The majority of US small business websites run on WordPress, and WordPress has predictable speed failure patterns. The following fixes address the most common real-world causes of CWV failures on WP sites—not the generic checklist items that rarely move the needle.
Image delivery: WordPress 6.1+ automatically adds lazy loading to below-the-fold images, but it also sometimes applies loading='lazy' to the LCP image by default in some themes. Check this specifically. The LCP image must never be lazy loaded. If your theme or page builder adds lazy loading to all images, you need to explicitly exclude the hero image.
Plugin bloat affecting INP: every active plugin that enqueues a front-end script adds to main thread load. Audit which plugins load scripts on pages where users actually land. The Health Check & Troubleshooting plugin lets you disable plugins selectively without affecting live visitors—use it to test INP before and after disabling suspected heavy plugins.
Hosting tier: shared hosting plans from budget providers frequently produce TTFB values of 800ms–2000ms, which makes hitting a Good LCP score nearly impossible regardless of other optimizations. Moving to managed WordPress hosting (or at minimum, a VPS with page caching) is often the single highest-leverage speed fix available to small business sites. This is a business decision, not just a technical one.
- Verify the LCP image does NOT have loading='lazy' applied—check page source
- Install Query Monitor to identify which plugins are adding front-end scripts
- Use Health Check & Troubleshooting plugin to test speed impact of individual plugins
- Enable GZIP/Brotli compression at the server level (most hosts offer this in cPanel)
- Check that your caching plugin excludes logged-in users and WooCommerce cart/checkout pages
- Use the free Autoptimize plugin carefully—its JS defer settings can break some themes; test on staging first
The Distinction Competitor Guides Miss: Score vs. Status
Most technical SEO checklists from major tools conflate PageSpeed score with CWV status. They list 'improve server response time' and 'minimize render-blocking JavaScript' as equivalent items regardless of your actual CWV field data. This conflation leads business owners to spend weeks optimizing for score improvements that don't move rankings.
The practical implication: if your site has 'Good' CWV status in Google Search Console—even with a PSI score of 60—you have no page speed SEO problem to solve. Your time is better spent on content, links, or other ranking factors. Conversely, a site with a PSI score of 88 but 'Poor' field-data LCP on mobile does have a real ranking problem, and the score is hiding it.
Always start diagnostic work with Google Search Console's Core Web Vitals report, not a tool score. The report tells you whether Google has a problem with your site's speed. The tools then help you find and fix the source of that problem.
FAQs
Does page speed directly affect Google rankings?
Yes, but through a specific mechanism: Core Web Vitals (LCP, INP, CLS) are a confirmed ranking signal. Google uses field data from real Chrome users, not your PageSpeed Insights score. Pages with 'Poor' CWV status receive a ranking penalty compared to equivalent pages with 'Good' status. The effect is most significant in competitive niches where other ranking factors are similar between competing pages.
What PageSpeed Insights score do I need for good SEO?
There is no target score. Google does not use the PageSpeed Insights composite score as a ranking signal. What matters is whether your Core Web Vitals reach 'Good' status in Google Search Console using real user data. A site scoring 55 with Good CWV field data outperforms a site scoring 90 with Poor field-data LCP, from a rankings perspective.
How long does it take to see ranking improvements after fixing page speed?
Core Web Vitals field data updates over a rolling 28-day window. After deploying fixes, Google needs to observe enough real user sessions to reflect the improvement. On a low-traffic site, this can take 4–8 weeks. On a higher-traffic site, changes may appear in Search Console within 3–4 weeks. Use 'Validate Fix' in Search Console to trigger re-evaluation.
Why does my PageSpeed score look different in GTmetrix vs. PageSpeed Insights?
The tools use different testing environments, server locations, and methodologies. GTmetrix runs tests from specific server locations (by default, Vancouver, Canada) and may use a different version of the Lighthouse engine. PageSpeed Insights runs from Google's infrastructure and also shows real-user field data when available. Neither score is 'wrong'—they're measuring different things. For SEO purposes, PageSpeed Insights and Google Search Console are authoritative.
My site passes Core Web Vitals but still ranks below competitors. Why?
Core Web Vitals is one ranking signal among many. Passing CWV removes a negative signal but doesn't guarantee rankings above competitors with stronger content relevance, more authoritative backlink profiles, better structured data, or more comprehensive coverage of the topic. Think of CWV as a floor requirement, not a differentiator.
Should I use a caching plugin or a CDN for the biggest speed improvement?
Both address different problems. A caching plugin (like WP Super Cache or W3 Total Cache) reduces server response time (TTFB) by serving pre-built HTML instead of generating pages dynamically. A CDN reduces latency by serving static assets from servers geographically closer to your visitors. For most small business sites, server-side caching has the larger LCP impact because it directly reduces TTFB. A CDN adds additional benefit but is secondary to fixing a slow origin server.
What is the LCP element and how do I find it?
The LCP (Largest Contentful Paint) element is the largest visible content block in the viewport when the page loads—usually a hero image, a large heading, or a text block. To find it: run PageSpeed Insights on your page and look for the 'Largest Contentful Paint element' diagnostic, which shows a screenshot of the element. Alternatively, open Chrome DevTools → Performance tab → record a page load → find the LCP marker in the timeline.
Do I need a developer to fix page speed issues?
It depends on which issues are failing. Image compression, adding width/height attributes, and font-display CSS changes are low-risk and manageable by a technically capable site owner. Deferring JavaScript, modifying caching configuration, and changing server infrastructure require developer involvement—particularly the testing and staging steps that prevent breaking site functionality. The higher the risk level of the fix, the more important it is to have a developer involved.
Related reading
Research notes
Background claims used while researching this article. Verify with the cited authorities before quoting.
- Google uses field data from the Chrome User Experience Report (CrUX) as the basis for Core Web Vitals ranking signals, prioritizing it over lab data
- INP replaced FID as a Core Web Vital in March 2024
- CWV evaluation uses the 75th percentile of field data
Marcus Chen
Head of Technical SEO · Findvex
Marcus Chen heads technical SEO at Findvex. He writes about Core Web Vitals, indexing, schema, and JavaScript SEO — translating Google’s documentation into checklists small business owners can actually act on.
Expertise: Core Web Vitals · Indexing & crawlability · Schema / structured data · JavaScript SEO
Related reads
Answer Engine Optimization (AEO): The 2026 Guide for Small Businesses
Learn answer engine optimization (AEO) in 2026. This practical guide helps small businesses get found in AI search, voice assistants, and answer engines.
SEOGenerative Engine Optimization (GEO): The 2026 Guide for Small Businesses
Learn how generative engine optimization helps small businesses get found in AI search. Our 2026 GEO guide covers strategies, tactics, and tips to boost visibility.
SEOSEO Agency in USA: AI-Powered SEO for Small Businesses | Findvex
Findvex is a leading SEO agency in USA delivering AI-powered SEO strategies that help small businesses rank higher, drive traffic, and grow revenue. Get started today.