Page Speed Optimization for Small Business Websites: The Diagnostic Sequence That Fixes the Right Things First
Page speed affects rankings, bounce rate, and Core Web Vitals scores. This guide tells you which diagnostic tools to run, in what order, what each metric actually means for your site, and which fixes move the needle fastest — starting with the ones your developer can action today.
Quick answer
To optimize page speed for a small business website: (1) Run Google PageSpeed Insights on your most important pages first. (2) Fix your Largest Contentful Paint (LCP) — typically caused by unoptimized hero images or render-blocking resources. (3) Eliminate layout shifts (CLS) by setting explicit dimensions on images and embeds. (4) Address Interaction to Next Paint (INP) by deferring non-critical JavaScript. These three metrics directly feed into Google's Core Web Vitals assessment, which is a confirmed ranking factor. Prioritize mobile scores over desktop.
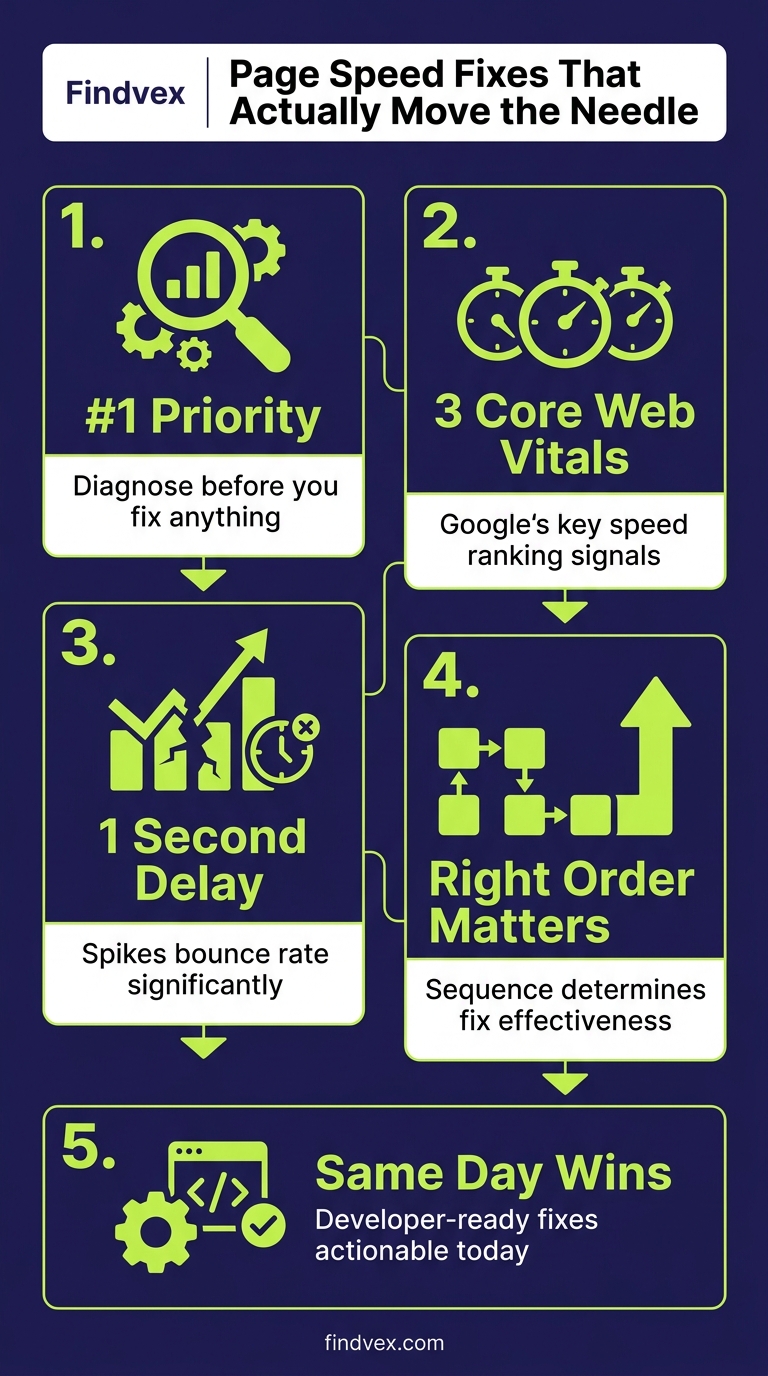
Why 'Improve Your Page Speed' Is Useless Advice Without a Diagnostic First
Page speed problems don't all look the same and they don't all matter the same. A site that fails on Largest Contentful Paint (LCP) needs different fixes than one failing on Cumulative Layout Shift (CLS). A WordPress site with too many plugins has different root causes than a Squarespace site slow-loading third-party scripts. Running the right diagnostic before touching any code is the difference between fixing real problems and spinning your wheels on optimizations that don't move your scores.
This guide gives you a sequenced approach: the right tools, in the right order, reading the output correctly, and fixing the highest-impact issues first. No generic 'compress your images' advice without telling you which images, by how much, and with which tool.
What Page Speed Actually Affects (and What It Doesn't)
Page speed affects your site in three distinct ways, and conflating them causes confusion about what to fix. First, Core Web Vitals — LCP, CLS, and INP — are confirmed Google ranking signals assessed through the Page Experience update. If your pages score 'Poor' in the CrUX (Chrome User Experience Report) dataset, you carry a measurable ranking disadvantage against competitors who score 'Good'.
Second, raw load time affects user behavior. Pages that feel slow increase bounce rate and reduce the likelihood of conversion — a visitor who bounces before your contact form loads is a lead you never got. Third, server response time (Time to First Byte, or TTFB) affects how quickly Googlebot can crawl your pages, which compounds with crawl budget constraints on larger sites.
What speed doesn't do: it won't rescue a page with weak content, no backlinks, or the wrong keyword targeting. Speed is a floor, not a ceiling. Get it to 'Good' and then focus on content and authority signals.
- Core Web Vitals (LCP, CLS, INP) → confirmed Google ranking factor
- Raw load time → affects bounce rate and conversion before any ranking consideration
- TTFB → affects Googlebot crawl efficiency, relevant for larger sites
- Speed alone doesn't compensate for weak content or zero authority
“AI agents do in hours what teams used to do in weeks. The advantage compounds.”
The Four Tools You Actually Need (and the Order to Use Them)
Most speed guides list every tool that exists. Here are the four that cover the full diagnostic picture for a small business site, used in a specific sequence that avoids wasted effort.
Step 1: Google PageSpeed Insights (PSI) — Your Starting Point
URL: pagespeed.web.dev. Run this on your homepage and your single most important service or product page — not just your homepage. PSI pulls two data sources: field data (real-user measurements from the CrUX dataset, labeled 'Discover what your real users are experiencing') and lab data (a simulated load from Lighthouse). Field data is what Google uses for ranking. Lab data tells you what's causing the problem.
Read the field data first. If you see 'Good' across LCP, CLS, and INP on mobile, your Core Web Vitals ranking factor is already satisfied — don't spend further time chasing a higher lab score. If any metric is 'Needs Improvement' or 'Poor', note which one before scrolling to the Diagnostics section.
Critical distinction: PSI lab scores simulate a mid-range Android device on a 4G connection. Your desktop score will almost always be higher. Google's ranking assessment uses field data on real devices, weighted toward mobile. Always check mobile first.
- Run on: homepage + highest-revenue page (not just homepage)
- Check field data first — that's the ranking signal
- Note which specific metric is failing: LCP, CLS, or INP
- Ignore the lab score number itself; use it only to identify causes
- Mobile score is the one that matters for ranking
Step 2: Google Search Console Core Web Vitals Report — Confirm Scale
PSI tests one URL at a time. The Core Web Vitals report in Google Search Console (Enhancements → Core Web Vitals) shows how many URLs across your entire site are scoring 'Poor', 'Needs Improvement', or 'Good' — aggregated from real-user data. This tells you whether you have an isolated problem on one page or a sitewide issue.
If GSC shows 40 URLs in 'Poor' on mobile and they're all your service pages, that's a template-level fix — likely an image, font load, or JavaScript issue baked into the page template. If it's only one or two URLs, those get fixed individually. The scale of the problem determines the solution approach.
- Navigate to: Search Console → Enhancements → Core Web Vitals
- Check mobile tab first
- If many URLs are 'Poor': look for shared template elements causing the issue
- If one or two URLs are 'Poor': investigate those pages specifically
- Click into any 'Poor' group to see example URLs — test those in PSI
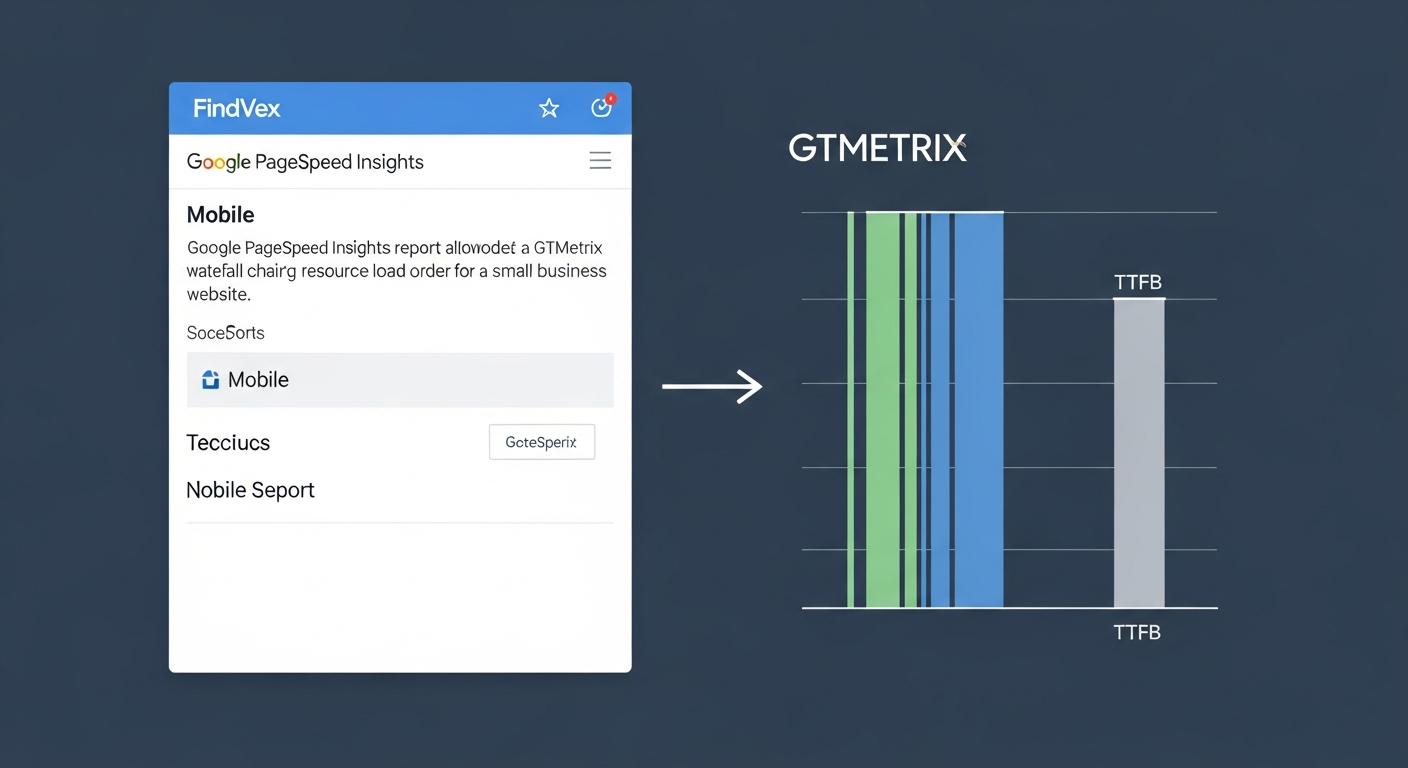
Step 3: GTmetrix — Waterfall Diagnosis for Root Causes
URL: gtmetrix.com. Free account gives you 7 tests/day from a US server location. GTmetrix's waterfall chart shows you every resource your page loads — HTML, CSS, JavaScript, images, fonts, third-party scripts — in chronological order, with file size and load time for each.
This is where you find the actual cause behind your PSI score. A slow LCP? Look for a large hero image loading late in the waterfall, or a render-blocking script that delays when the browser can start painting. Slow TTFB? Your hosting server response time appears as the very first bar in the waterfall.
What to look for specifically: any resource over 500KB (especially images), any render-blocking CSS or JS in the first few bars, and third-party scripts (Google Tag Manager, Facebook Pixel, chat widgets) that load early and block rendering.
- Set test location to Dallas or New York (closest to most US audiences)
- Look for: images over 500KB, render-blocking scripts in early waterfall
- Third-party scripts that load before your main content are common LCP killers
- High TTFB (over 600ms) indicates a hosting or server-side caching problem
- Download the full waterfall report to share with your developer
Step 4: WebPageTest — Film Strip and Visual Rendering
URL: webpagetest.org. This is the most advanced free tool available, and the one closest to what technical SEOs use professionally. The film strip view shows you exactly what your page looks like at 0.5-second intervals during loading — this makes LCP and CLS problems immediately visible. You can literally see when your hero image appears and whether content shifts around.
Run this when PSI tells you there's an LCP or CLS problem but the GTmetrix waterfall isn't giving you a clear answer. The 'Opportunities & Experiments' section also lets you test what your score would be if you eliminated specific resources — useful for prioritizing which fix to do first.
- Use film strip view to visualize when LCP element actually appears
- CLS issues are visible as content jumping in the film strip
- Run from 'Virginia, EC2' for a standard US baseline
- Use Opportunities to test hypothetical fixes before implementing them
What to Check in Google Search Console Before You Fix Anything
Before writing a single line of fix code, open GSC and collect this specific data. It prevents you from fixing the wrong things.
Core Web Vitals report: Download the list of 'Poor' URLs for mobile. These are your priority pages. If you don't have field data (newer site or low traffic), GSC will show 'Not enough data' — in that case, use only lab data from PSI as a proxy.
Page Indexing report: Quickly verify the pages you're planning to speed-optimize are actually indexed. There's no ranking benefit from speeding up a page that isn't being shown to searchers.
Search results performance: Check which pages generate your most impressions and clicks. Cross-reference with your Core Web Vitals 'Poor' list. Pages that rank well but score 'Poor' on CWV are at risk — prioritize those above pages that neither rank nor score well.
- Core Web Vitals → download 'Poor' URL list for mobile
- Page Indexing → confirm speed-target pages are indexed
- Performance → identify high-impression pages with 'Poor' CWV scores (highest fix priority)
- Note: GSC CWV data lags by approximately 28 days — don't expect immediate score changes after fixes
Page Speed Diagnosis Checklist
Use this before handing off any work to a developer or making CMS changes yourself.
- ☐ Run PSI on mobile for homepage and top service page — note which CWV metrics fail
- ☐ Open GSC Core Web Vitals report — confirm whether the issue is sitewide or isolated
- ☐ Run GTmetrix waterfall — identify the largest resources and render-blocking scripts
- ☐ List all third-party scripts loading on the page (GTM, chat, analytics, social embeds)
- ☐ Check hero image file size — if over 200KB for mobile, flag for compression
- ☐ Check TTFB in GTmetrix — if over 600ms, flag hosting/caching as root cause
- ☐ Check for images missing explicit width/height attributes (CLS cause)
- ☐ Check for web fonts loading without font-display: swap or optional
- ☐ Cross-reference slow pages with GSC performance data — prioritize by traffic impact
What to Fix First: The Prioritized Sequence
Not all speed improvements take the same effort or deliver the same return. This is the order that typically gets small business sites from 'Poor' to 'Good' fastest, based on what causes failures most often.
Fix 1: Hero Image Size and Format (High Impact, Low Risk)
Oversized hero images are the single most common cause of LCP failures on small business sites. The fix is specific: compress the hero image to under 150KB for mobile delivery, serve it in WebP format (with JPEG fallback for older browsers), and add the 'loading=eager' and 'fetchpriority=high' attributes to the hero image tag so the browser knows to load it before other resources.
For WordPress: use the Imagify, ShortPixel, or Squoosh (free) plugins to convert and compress existing images. Set your image compression to 'Lossy' — most small business photography is not fine-art printing and can handle 75–80% quality without visible degradation.
Risk level: Low. Image compression is reversible. Test in a staging environment if you have one, but this is the lowest-risk fix on the list.
- Target: hero image under 150KB for mobile
- Format: WebP with JPEG fallback
- Add fetchpriority='high' to the hero image HTML tag
- Tools: Squoosh.app (free, browser-based), ShortPixel (WordPress plugin)
- Owner: can be done by a non-developer with CMS access
- Risk: Low
Fix 2: Server-Side Caching and CDN (High Impact, Medium Risk)
If your TTFB in GTmetrix is over 600ms, no amount of image optimization will get you to 'Good' on LCP. TTFB reflects how long your server takes to respond before sending any content. The fix is a caching layer between your server and the visitor.
For WordPress on shared hosting: install WP Rocket, W3 Total Cache (free), or LiteSpeed Cache (if your host runs LiteSpeed). Enable page caching, browser caching, and GZIP compression. These settings tell the server to save a pre-built copy of each page and serve that copy instead of rebuilding the page from the database on every request.
For better results, add a CDN (Content Delivery Network). Cloudflare's free tier delivers your static assets (images, CSS, JS) from servers physically close to your visitor, reducing round-trip time. This is especially impactful if your hosting server is on the East Coast but a significant portion of your customers are in the West.
Risk level: Medium. Caching plugins can occasionally conflict with other plugins or cause pages to display outdated content. Test on staging first, or at minimum check all form submissions and dynamic content after enabling.
- Symptom: TTFB over 600ms in GTmetrix
- Fix: Enable server-side page caching
- WordPress plugins: WP Rocket (paid), LiteSpeed Cache (free), W3 Total Cache (free)
- Add Cloudflare free CDN for static asset delivery
- Developer handoff: share GTmetrix report, show TTFB bar, request caching configuration
- Risk: Medium — test after enabling, verify forms and dynamic content still work
Fix 3: Defer Non-Critical JavaScript (Medium Impact, Medium Risk)
JavaScript that loads and executes before your page's visible content is painted causes LCP delays and INP failures. Look in your GTmetrix waterfall for JS files loading in the first few bars, especially those tagged as 'render-blocking'. Common culprits: jQuery loading synchronously, Google Tag Manager with too many triggers, third-party chat widgets, and poorly coded slider/carousel plugins.
The fix has two parts. First, add 'defer' or 'async' attributes to non-critical script tags — 'defer' executes the script after the HTML is parsed but before DOMContentLoaded, 'async' executes it as soon as it downloads. For most small business JavaScript (analytics, chat), 'defer' is the right attribute.
Second, review what's firing inside Google Tag Manager. Every tag that fires on page load adds to INP. Audit your GTM container and remove tags you don't recognize or that haven't been used in six months.
Risk level: Medium. Deferring scripts that other scripts depend on can break functionality. Have a developer implement this if you're not comfortable reading JavaScript dependencies. If you're on WordPress with a caching plugin, it may have a 'defer JS' option — use that before touching the code directly.
- Symptom: render-blocking JS in waterfall, INP failing in PSI
- Fix: add defer or async to non-critical script tags
- Quick win: audit Google Tag Manager — remove unused tags
- WordPress: WP Rocket and LiteSpeed Cache have built-in JS deferral options
- Developer handoff: share waterfall screenshot, highlight render-blocking resources
- Risk: Medium — test after deferring, check all interactive page elements still work
Fix 4: Eliminate Layout Shift (CLS) — Set Explicit Image Dimensions
Cumulative Layout Shift measures how much page content moves around during loading — a metric that directly maps to user frustration when content jumps while you're reading or trying to click something. The most common cause is images without explicit width and height attributes. When the browser loads an image without knowing its dimensions in advance, it reserves no space for it — then shifts everything else when the image loads.
The fix is to add explicit width and height attributes to all img tags in your HTML. This doesn't mean the image will be exactly that pixel size on screen — CSS still controls visual sizing — but it tells the browser the aspect ratio so it can reserve space before the image loads.
Other CLS causes: dynamically injected banners or cookie consent bars that push content down after it's already been rendered, and web fonts that cause a Flash of Unstyled Text (FOUT) by swapping to a different-width font mid-render. For fonts, add 'font-display: swap' to your @font-face declarations, or use 'font-display: optional' on less critical fonts.
Risk level: Low. Adding width/height attributes to images is a non-breaking change.
- Symptom: CLS over 0.1 in PSI, content visibly jumping in WebPageTest film strip
- Fix: add explicit width and height attributes to all img tags
- Additional fix: add font-display: swap to @font-face CSS declarations
- Check for: cookie banners, chat widgets, or ads injecting into the layout after load
- Developer handoff: share film strip from WebPageTest showing shift frame
- Risk: Low
Fix 5: Audit Third-Party Scripts (Medium Impact, Low Risk to Remove)
Third-party scripts are often the silent killers on small business sites. Every external script — live chat widgets, review badges, social media embeds, A/B testing tools, heatmap tools, advertising pixels — adds network requests, often runs JavaScript during page load, and introduces latency you don't control because it comes from someone else's server.
Run a quick audit: open Chrome DevTools, go to Network tab, reload the page, and filter by 'Script'. Every script loaded from a domain you don't own is a third-party script. For each one, ask: is it actively being used, and is its business value worth the load-time cost?
The fix for scripts you can't remove: load them lazily after the main content has rendered. Most chat widgets support a 'lazy load' option in their settings. For analytics and pixels, ensure they're loaded through GTM with a 'DOM Ready' or 'Window Loaded' trigger rather than 'All Pages' trigger, which fires as early as possible.
Risk level: Low to remove unused scripts. Medium to change loading triggers — test that conversion tracking still fires correctly.
- Audit tool: Chrome DevTools → Network → filter by Script
- Flag: any script loading from a domain you don't own
- Remove: scripts for tools you don't actively use (old A/B test tools, unused chat widgets)
- Defer: set GTM tags to fire on 'Window Loaded' trigger instead of 'All Pages'
- Developer handoff: list of third-party scripts with source domains and estimated size from GTmetrix waterfall
- Risk: Low (removing unused), Medium (changing trigger timing — verify conversion tracking)
Developer Handoff Notes
If you're a business owner, not a developer, here's exactly what to send your developer or agency to get these fixes implemented without lengthy back-and-forth.
- PSI report screenshot: include the full Diagnostics section, not just the score number
- GTmetrix waterfall: download the PDF report (available on free account) — this shows every resource with file size and load time in one document
- GSC Core Web Vitals: share a screenshot of the mobile report with 'Poor' URL count highlighted
- WebPageTest film strip: share the URL of your saved test (webpagetest.org generates a permanent link) — this shows CLS and LCP visually
- Specify which pages to fix first: list them by GSC impression volume, highest first
- Ask for: staging environment test before deploying changes to the live site
- Ask for: before/after PSI screenshots for each fix so you can verify improvement
Platform-Specific Considerations for Small Business Sites
The root causes and fix mechanisms differ by platform. Here's what applies to the most common small business setups.
- WordPress: most speed issues come from plugins (too many, poorly coded) and unoptimized images. Use WP Rocket or LiteSpeed Cache for caching + JS deferral. Use Imagify or ShortPixel for bulk image optimization. Avoid page builders with heavy JS (Elementor with full bloat enabled) where possible.
- Shopify: hosting performance is managed by Shopify — TTFB is generally good. Main issues are app scripts loading at checkout and product images served at full size. Use Shopify's native image resizing via liquid filters (img_url with size parameter). Audit installed apps — each active app typically adds at least one script.
- Squarespace/Wix: limited direct control over server configuration and script loading. Focus on what you can control: image file sizes before upload, removing unused blocks/sections that add script weight, and avoiding too many third-party embed blocks on high-traffic pages.
- Webflow: generally good baseline performance. Main issues are large background videos, unoptimized interaction animations, and custom code blocks adding external scripts. Use Webflow's built-in asset optimization settings and lazy load all images below the fold.
Stop Chasing the Perfect Score: When 'Good' Is Enough
A 100/100 PageSpeed score is not a realistic target for most small business sites, and chasing it past the 'Good' threshold on Core Web Vitals has diminishing returns. The ranking signal kicks in at the 'Good' threshold, not at a score of 100. Spending two weeks removing a chat widget to improve your lab score from 78 to 85 is time that would be better spent on content, local citations, or link acquisition.
The practical targets: LCP under 2.5 seconds (Good threshold), CLS under 0.1, INP under 200ms. Get field data (from GSC or PSI field data section) to these levels on mobile, and your page experience ranking signal is satisfied. Everything beyond that is for user experience, not ranking.
- Good threshold (ranking signal satisfied): LCP < 2.5s, CLS < 0.1, INP < 200ms
- Field data thresholds matter — not the lab score number
- Once all three metrics are 'Good' in field data on mobile: stop optimizing speed, redirect effort elsewhere
- Lab scores over 90 don't provide additional ranking benefit over lab scores of 70 if field data is 'Good'
FAQs
Does page speed directly affect Google rankings?
Yes, but specifically through Core Web Vitals — LCP, CLS, and INP. These are confirmed Google ranking signals assessed through the Page Experience update. The ranking benefit kicks in when your field data crosses the 'Good' threshold (LCP under 2.5s, CLS under 0.1, INP under 200ms). Raw page speed beyond these thresholds doesn't provide additional ranking benefit.
What's the difference between PageSpeed Insights and GTmetrix?
PageSpeed Insights pulls real-user field data from Google's Chrome User Experience Report (CrUX) — that's the data Google uses for ranking. GTmetrix runs a controlled lab test that shows you a waterfall chart of every resource loading on your page. Use PSI to understand your ranking situation; use GTmetrix to diagnose the causes. They answer different questions.
My PageSpeed Insights desktop score is 90+ but mobile is 45. Which matters for SEO?
Mobile. Google's ranking assessment uses field data weighted toward mobile devices. The desktop score is useful for understanding performance on desktop but is not the primary ranking signal. Always optimize for mobile first, and check mobile field data in PSI and Google Search Console Core Web Vitals.
How long does it take to see improved Core Web Vitals scores in Google Search Console after fixing issues?
Google Search Console's Core Web Vitals report uses the CrUX dataset, which aggregates real-user data over a 28-day rolling window. After deploying fixes, expect a 4–6 week lag before the GSC report reflects the improvement. You can validate fixes immediately using PSI lab data and GTmetrix, but field data takes longer to update.
Should I use a page speed plugin or hire a developer to fix speed issues?
It depends on the root cause. Image optimization and installing a caching plugin can be done by a non-developer with CMS access — these cover most common causes. JavaScript deferral, fixing render-blocking resources at the code level, and server configuration changes require developer involvement. Use the diagnostic tools first to identify the actual cause, then decide who should own the fix.
Can a slow homepage hurt SEO on other pages of my site?
The Core Web Vitals ranking signal is assessed on a per-URL basis using page-level field data, not site-level averages. A slow homepage doesn't directly reduce rankings for your service pages. However, Google Search Console groups pages with similar URL patterns — if many pages share the same slow template, they'll all be assessed as 'Poor'. Fix template-level issues first when many pages are affected.
Is a high TTFB always a hosting problem?
TTFB over 600ms is usually a hosting or server-side caching problem, but not always. It can also be caused by slow database queries (common on WordPress sites with too many plugins or unoptimized databases), PHP configuration, or a CDN that's routing requests sub-optimally. If installing a caching plugin doesn't resolve high TTFB, the problem is likely at the hosting or database level and requires a developer to investigate.
Related reading
Research notes
Background claims used while researching this article. Verify with the cited authorities before quoting.
- Core Web Vitals (LCP, CLS, INP) are confirmed Google ranking signals via the Page Experience update — verify via Google Search Central documentation on Page Experience and Core Web Vitals ranking signal — cite official Google developer documentation URL when publishing
- CrUX data lags by approximately 28 days — verify via Google Chrome UX Report documentation on data freshness and rolling window — cite official Chrome UX Report docs when publishing
- Good thresholds: LCP under 2.5s, CLS under 0.1, INP under 200ms — verify via Google web.dev Core Web Vitals thresholds page — cite when publishing to confirm thresholds haven't changed since article production date
Marcus Chen
Head of Technical SEO · Findvex
Marcus Chen heads technical SEO at Findvex. He writes about Core Web Vitals, indexing, schema, and JavaScript SEO — translating Google’s documentation into checklists small business owners can actually act on.
Expertise: Core Web Vitals · Indexing & crawlability · Schema / structured data · JavaScript SEO
Related reads
Answer Engine Optimization (AEO): The 2026 Guide for Small Businesses
Learn answer engine optimization (AEO) in 2026. This practical guide helps small businesses get found in AI search, voice assistants, and answer engines.
SEOGenerative Engine Optimization (GEO): The 2026 Guide for Small Businesses
Learn how generative engine optimization helps small businesses get found in AI search. Our 2026 GEO guide covers strategies, tactics, and tips to boost visibility.
SEOSEO Agency in USA: AI-Powered SEO for Small Businesses | Findvex
Findvex is a leading SEO agency in USA delivering AI-powered SEO strategies that help small businesses rank higher, drive traffic, and grow revenue. Get started today.