INP Core Web Vital: What It Measures, Why It Replaced FID, and How to Fix It on Small Business Sites
INP measures how quickly your page visually responds to every click, tap, and keypress — not just the first one. A score above 200ms can hurt your Google rankings. Here's how to diagnose it and fix the most common causes on small business websites.
Quick answer
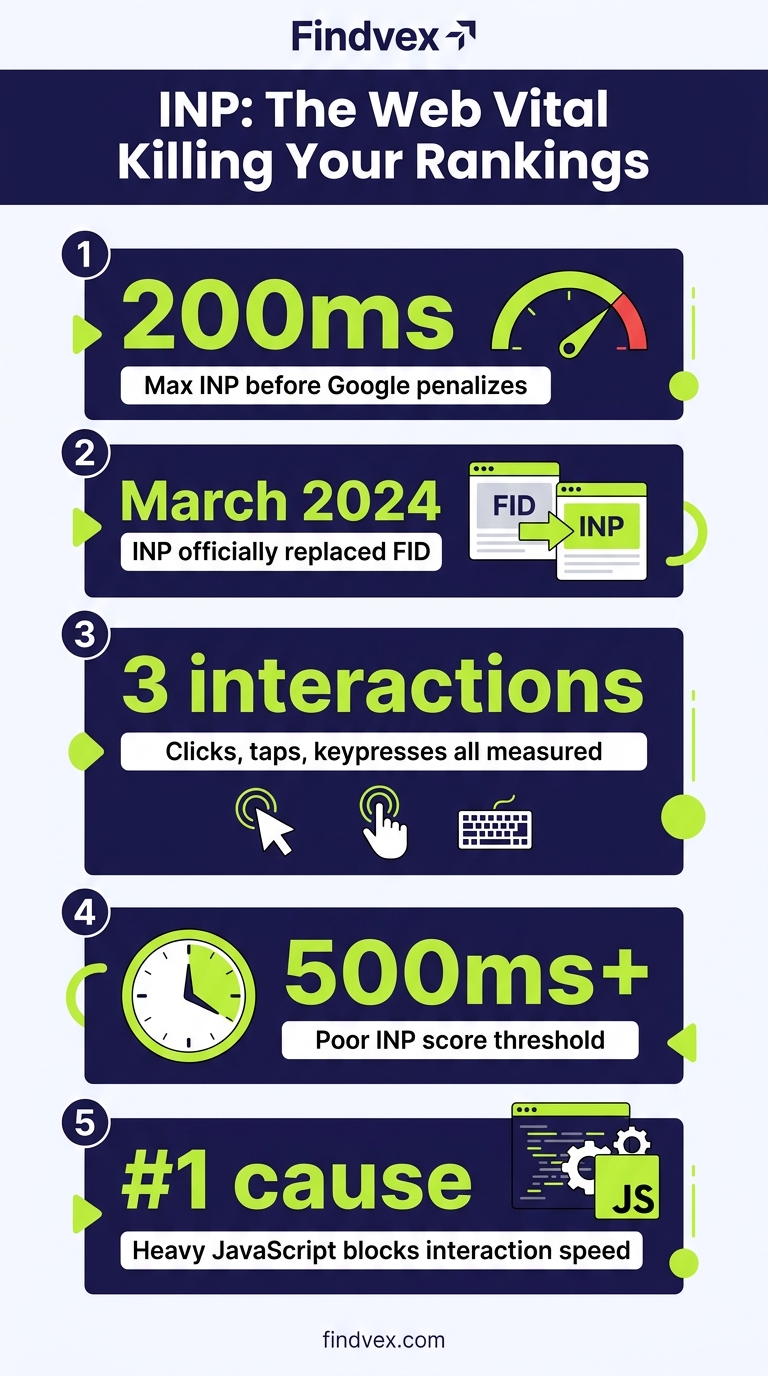
INP (Interaction to Next Paint) is a Core Web Vital that measures how long it takes for a page to visually respond after a user clicks, taps, or presses a key — across every interaction during a visit, not just the first. A good INP score is 200ms or less. INP replaced First Input Delay (FID) as Google's responsiveness metric on March 12, 2024. To fix a poor INP score, reduce long JavaScript tasks on the main thread, defer non-critical scripts, and avoid layout operations triggered by user interactions.
Section 1
If your site feels sluggish when someone clicks a menu item, submits a form, or taps a button — that lag is exactly what INP captures. Unlike its predecessor First Input Delay (FID), which only measured the delay before your browser started processing the very first interaction, INP scores every click, tap, and keypress throughout the entire session and reports the worst-case latency.
That shift matters. A page that loads fast but freezes when users interact will now show up as poor in Google's Core Web Vitals assessment. For small business sites running heavy WordPress themes, multiple plugins, or third-party chat widgets, INP is often the metric that's silently failing.
What INP Actually Measures (and Why It's Harder to Pass Than FID)
INP stands for Interaction to Next Paint. It measures the time between a user interaction — a click, tap, or physical key press — and when the browser next paints a visible change to the screen in response. The score Google uses is the worst interaction latency recorded at the 75th percentile of real user sessions (field data), not a lab average.
FID only measured input delay: the gap between the event firing and when the browser could start processing it. INP measures the full pipeline: input delay + processing time + presentation delay. That means even if your main thread isn't blocked at the moment a user clicks, slow event handlers or expensive DOM updates will still produce a poor INP score.
This is why many sites that previously passed FID now fail INP. FID was measuring a narrow slice of responsiveness. INP is measuring what users actually experience.
- FID: Delay before the first interaction's event handler starts (partial measure)
- INP: Full latency from user input → JavaScript processing → visual update on screen (complete measure)
- FID only scored the first interaction; INP scores all interactions and picks the worst representative one
- INP became an official Core Web Vital on March 12, 2024, replacing FID
“AI agents do in hours what teams used to do in weeks. The advantage compounds.”
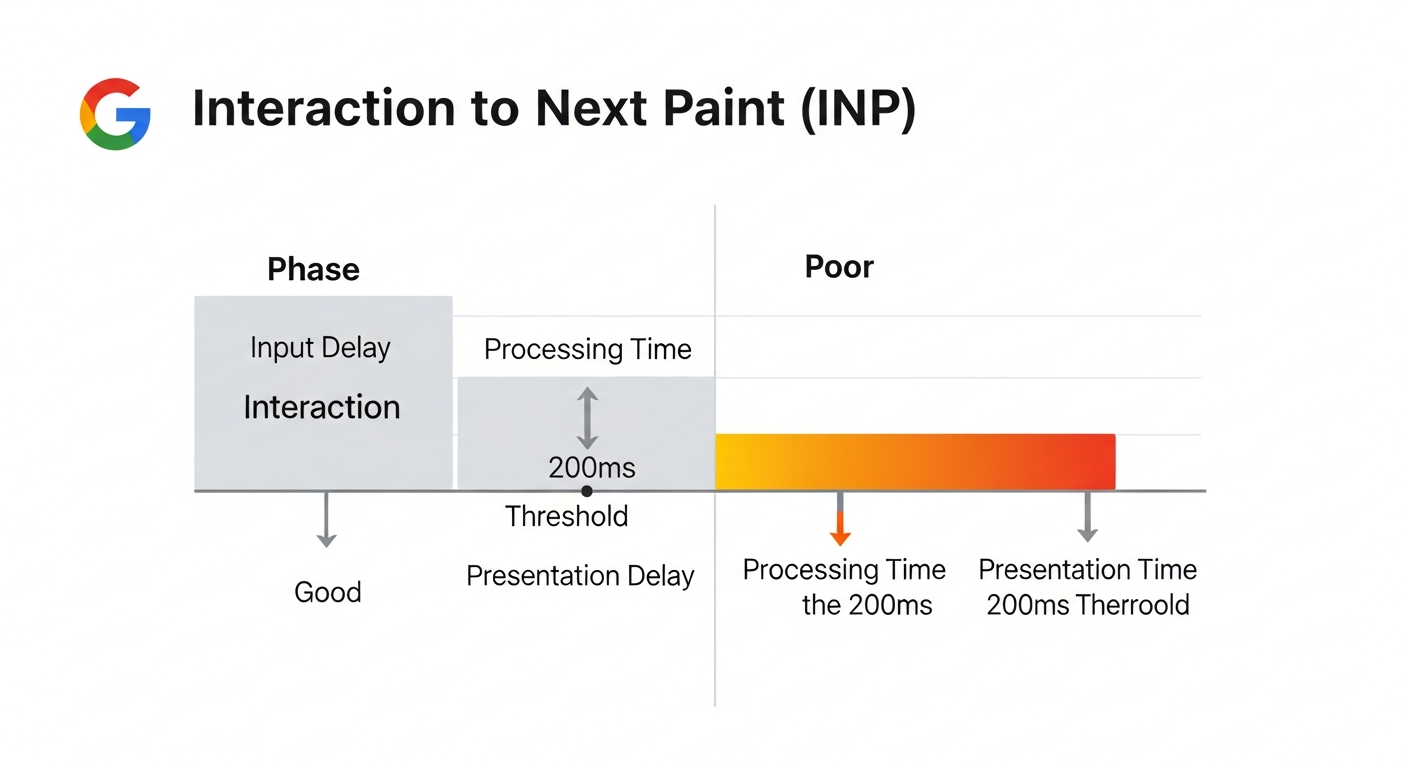
The Three Phases of an INP Interaction
Every interaction INP captures runs through three sequential phases. Understanding which phase is causing your slow score determines which fix you need.
- 1. Input Delay — The time between the user's action and when the browser begins running event handlers. This grows when the main thread is busy with a long task (e.g., a script executing when the user clicks). Target: under 50ms.
- 2. Processing Time — How long your event handlers take to execute. Heavy JavaScript in click handlers, framework re-renders, or data fetching directly in event listeners all inflate this phase.
- 3. Presentation Delay — The time from when event handlers finish to when the browser paints the visual update. Large DOM trees, CSS that triggers layout recalculation, and complex animations are common causes.
INP Score Thresholds: What Good, Needs Improvement, and Poor Mean
Google uses three bands to classify INP at the 75th percentile of page loads with sufficient field data.
- Good: 200ms or less — Interactions feel near-instant to users
- Needs Improvement: 201ms to 500ms — Noticeable lag; users may hesitate or repeat actions
- Poor: Above 500ms — Interactions feel broken; significant risk of user abandonment
INP Diagnosis Checklist: Find the Cause Before You Fix Anything
Don't jump to solutions before you've identified which phase is failing. Use this checklist in order.
- ☐ Run PageSpeed Insights on your highest-traffic pages — not just the homepage. Filter by mobile (where INP is typically worse due to slower CPUs).
- ☐ Open Chrome DevTools → Performance tab. Click Record, interact with the page (click buttons, open menus, submit forms), then stop. Look for long tasks (red bars) that overlap with your interactions.
- ☐ Use the Interactions section in the Performance panel to see per-interaction timing breakdown: input delay, processing time, presentation delay.
- ☐ Install the Web Vitals Chrome Extension to capture INP in real time as you browse your own site.
- ☐ Check the Long Animation Frames (LoAF) API data in DevTools — it identifies which scripts are causing frame delays.
- ☐ Identify which specific interaction is worst: navigation menus, forms, accordions, or filter/sort controls are common culprits on small business sites.
- ☐ Note whether the problem occurs during page load (when scripts are still executing) or after load — the fix differs.
- ☐ Check if third-party scripts (live chat, analytics, ad pixels, booking widgets) are contributing to main thread blocking.
What to Check in Google Search Console for INP
Google Search Console's Core Web Vitals report shows INP data aggregated from real Chrome users (CrUX data). Here's exactly where to look and what the data means.
- Navigate to: Search Console → Experience → Core Web Vitals
- Select Mobile and Desktop reports separately — mobile INP scores are typically worse
- Look for URLs grouped under 'Poor INP' or 'Needs Improvement INP' — these are pages with enough real-user data to be assessed
- Click into a URL group to see which specific page templates are affected (e.g., all product pages, all contact pages)
- After making fixes, click 'Validate Fix' — GSC requires roughly 28 days of field data to confirm improvement
- If you see 'Insufficient data' for INP, your site doesn't have enough Chrome user traffic for CrUX to generate a score — use PageSpeed Insights lab data and Chrome DevTools instead
- Cross-reference with the Page Experience report to see whether pages pass or fail the combined Core Web Vitals assessment
The Most Common INP Causes on Small Business Websites
Small business websites — particularly those built on WordPress with page builders like Elementor or Divi — have predictable INP failure patterns. These are the causes I see most consistently when auditing sites in the 500ms–2000ms range.
- Heavy page builder JavaScript: Elementor, Divi, and WPBakery load large JS bundles that keep the main thread busy during and after page load. Every interaction competes with ongoing script execution.
- Unoptimized third-party scripts: Live chat widgets (Intercom, Drift, Tidio), Google Tag Manager containers with many tags, Facebook Pixel, and booking plugins often register event listeners that slow down interaction processing.
- WordPress plugins with synchronous event handlers: Form plugins, slider plugins, and WooCommerce cart interactions frequently execute blocking code in click handlers.
- Large DOM trees: Sites built with visual page builders often generate 2,000–5,000+ DOM nodes. Interactions that trigger layout recalculation across a large DOM are slow to paint.
- Non-deferred JavaScript: Scripts loaded in the <head> without async/defer block the main thread early, extending input delay for early interactions.
- WooCommerce and e-commerce interactions: Add-to-cart, quantity changes, and coupon field inputs are interaction-heavy and often poorly optimized.
- Cumulative script load from plugins: Each active WordPress plugin typically adds JS. 20–30 active plugins routinely produce 500KB–2MB of JavaScript on a single page.
How to Fix INP: Fixes Ordered by Impact and Risk
The fixes below are ordered from lowest risk / highest impact to higher risk / developer-required. Match the fix to the phase you diagnosed.
Fix 1: Reduce Input Delay by Breaking Up Long Tasks
If DevTools shows long tasks (tasks exceeding 50ms) on the main thread during page load, those tasks create input delay for any interaction that fires during them. The browser can't process clicks until the current task finishes.
Risk level: Medium (requires developer involvement for custom code; lower risk if using plugin settings).
For WordPress sites: Use a caching plugin (WP Rocket, LiteSpeed Cache) to enable JavaScript deferral. Set non-critical scripts to load with the 'defer' attribute so they don't block the main thread early. In WP Rocket, the 'Delay JavaScript execution' setting defers script loading until user interaction — effective for reducing early input delay.
For custom code: Use scheduler.yield() to break long synchronous tasks into smaller chunks, allowing the browser to handle user input between them. This is a developer task — pass the DevTools Performance trace to your developer to identify which specific function calls need yielding.
- Defer non-critical third-party scripts (chat widgets, analytics) until after the page is interactive
- Use Google Tag Manager's 'Window Loaded' trigger instead of 'DOM Ready' for non-essential pixels
- Audit and remove plugins whose scripts aren't needed on every page — use Asset CleanUp Pro or WP Rocket's per-page script exclusion
Fix 2: Reduce Processing Time in Event Handlers
If the input delay is low but processing time is high, the problem is inside your event handler code. This is almost always a developer-owned fix.
Risk level: Medium to High — modifying event handlers requires testing.
Common causes: Frameworks re-rendering large component trees on every click, synchronous API calls inside click handlers, heavy DOM manipulation in response to user input.
The practical fix for non-developers: Identify which specific interaction is slow (use DevTools Interactions panel), then take a screenshot of the call stack to your developer. The goal is to move work that doesn't need to happen synchronously into a setTimeout or requestIdleCallback, so the browser can paint a visual response first and do the heavy processing after.
- Show optimistic UI updates immediately (e.g., visually mark a button as 'clicked' before processing completes)
- Move non-visual processing (analytics events, data writes) out of the synchronous interaction path
- Use requestIdleCallback for work that doesn't affect the immediate visual response
Fix 3: Reduce Presentation Delay by Simplifying DOM and CSS
Presentation delay is caused by expensive rendering work after event handlers finish. The browser has to recalculate layout, repaint, and composite before the next frame appears.
Risk level: Low to Medium.
Reducing DOM size is the highest-impact, lowest-risk fix. Use Chrome DevTools → Performance → 'Rendering' to enable 'Layout Shift Regions' and 'Paint Flashing' — interactions that cause full-page repaints will be immediately visible.
- Target DOM node count below 1,500 nodes on any given page — audit with Lighthouse (DOM Size warning appears above 1,400 nodes)
- Use CSS contain: content on components that update independently to prevent the browser from recalculating the entire page layout
- Avoid reading layout properties (offsetHeight, getBoundingClientRect) immediately before writing to the DOM — this forces synchronous layout recalculation (layout thrashing)
- Use CSS transform and opacity for animations instead of properties that trigger layout (width, height, top, left)
- For WordPress: Reduce the number of nested page builder rows and columns — each layer adds DOM depth and increases layout recalculation cost
WordPress-Specific INP Fix Workflow (No Developer Required for First Pass)
If you're on WordPress without a dedicated developer, this is the sequence to follow before escalating to code-level changes. Each step can be validated in PageSpeed Insights before moving to the next.
- Step 1 — Audit active plugins: Deactivate plugins one at a time in a staging environment and re-test INP in PageSpeed Insights. This isolates which plugin is the primary offender. Focus on plugins that add front-end scripts (sliders, forms, chat, popups, social feeds).
- Step 2 — Enable JavaScript deferral: In WP Rocket or LiteSpeed Cache, enable 'Delay JavaScript execution' or equivalent. Test thoroughly — some plugins break when their scripts are deferred.
- Step 3 — Limit Google Tag Manager tags: Open GTM, audit all tags. Remove or consolidate firing triggers. A GTM container with 30+ tags can add 200–400ms of main-thread work.
- Step 4 — Disable native lazy loading on above-the-fold content: Ensure loading='lazy' is NOT applied to your hero image or any image visible on load — this can indirectly affect when scripts run.
- Step 5 — Switch to a lightweight theme: If using Elementor or Divi, test your INP with a minimal theme (GeneratePress, Kadence, Astra) and the same content. If INP improves significantly, the page builder's JS overhead is the core problem.
- Step 6 — Escalate to developer with DevTools trace: If INP is still above 500ms after the above steps, export a Performance trace from Chrome DevTools and hand it to a developer with specific interaction names and timing data.
Developer Handoff Notes for INP Fixes
If you're handing this to a developer, give them the following context so they can fix the right thing without guessing.
- Export a Chrome DevTools Performance trace (.json file) showing the specific slow interaction — File → Save Profile
- Annotate which interaction is worst: 'Click on the main nav hamburger menu takes 800ms to open on mobile' is more actionable than 'INP is bad'
- Share the Long Animation Frames (LoAF) data: In DevTools console, run PerformanceObserver to log LoAF entries, or use the web-vitals.js library to surface the attribution data
- Specify the target: 200ms or less at the 75th percentile on mobile, measured in PageSpeed Insights field data
- Confirm the fix in a staging environment using Chrome DevTools before deploying — real-user data in GSC takes 28 days to update
- Ask for passive event listeners on scroll and touch events: addEventListener('touchstart', handler, { passive: true }) — this is a low-risk performance improvement that reduces input delay for scroll-adjacent interactions
INP's Actual Impact on SEO Rankings
INP is an official Core Web Vitals metric, and Core Web Vitals are part of Google's Page Experience signals, which are a confirmed ranking factor. That said, the direct ranking impact of INP alone is modest — Google has been consistent that content relevance, E-E-A-T, and authority signals carry more weight than page experience in competitive queries.
The more direct impact is on conversion and engagement: slow interactions cause users to abandon forms, retry clicks, and leave. These behavioral signals may influence rankings indirectly. For competitive local searches where multiple businesses have similar content quality, a 'Good' Core Web Vitals assessment versus a 'Needs Improvement' rating could be a differentiator.
The highest-priority scenario for INP: if your site fails the Core Web Vitals assessment entirely (all three metrics — LCP, INP, CLS — must pass for a 'Good' assessment), fixing INP may be the change that gets you to a passing assessment. That threshold matters more than the individual INP score.
- Passing the overall Core Web Vitals assessment (Good LCP + Good INP + Good CLS) is the relevant threshold for Page Experience signals
- INP failures on mobile are more common and more impactful given Google's mobile-first indexing
- A failed INP assessment in GSC will show the specific pages affected — prioritize fixing high-traffic, high-conversion pages first
INP vs FID: The Key Differences That Still Confuse Site Owners
FID was deprecated in March 2024 but still appears in some older audits and documentation. Here's the practical summary of what changed and why it matters.
- FID measured only input delay (delay before event handler started) on the first interaction only
- INP measures the full interaction latency (input delay + processing + presentation) across all interactions
- A site could score 'Good' on FID but 'Poor' on INP if later interactions (post-load menu clicks, form submissions) are slow
- FID threshold: Good was under 100ms; INP threshold: Good is under 200ms — different scales, different metrics
- If your older SEO audit shows 'Good FID', that data is obsolete — check current INP scores in PageSpeed Insights or GSC
- INP data comes from Chrome User Experience Report (CrUX) field data — requires real user traffic to generate a score
FAQs
What is a good INP score?
A good INP score is 200 milliseconds or less at the 75th percentile of real user interactions. Scores between 201ms and 500ms need improvement, and scores above 500ms are classified as poor. Google uses field data (real Chrome user sessions) collected via CrUX to determine your site's INP score in Google Search Console and PageSpeed Insights.
Why did Google replace FID with INP?
FID only measured how long the browser waited before starting to process the very first user interaction — it didn't measure whether that interaction (or any subsequent one) actually resulted in a fast visual response. INP measures the complete interaction latency across all clicks, taps, and keypresses during a session, giving a much more accurate picture of how responsive a page actually feels to users.
Does INP directly affect Google rankings?
INP is part of Core Web Vitals, which are a confirmed ranking factor in Google's Page Experience signal. However, Google has stated that content relevance and authority carry more weight. The practical threshold that matters is whether your site achieves a 'Good' Core Web Vitals assessment overall (passing LCP, INP, and CLS together) — that's more significant than your INP milliseconds in isolation.
Why is my INP worse on mobile than desktop?
Mobile devices have slower CPUs than desktop computers, which means JavaScript tasks take longer to execute. The same event handler that runs in 80ms on a desktop may take 300–400ms on a mid-range Android phone. Since Google uses mobile-first indexing and CrUX captures a range of device capabilities, mobile INP scores reflect the experience of users on slower hardware. Focus your INP fixes on reducing main thread work rather than relying on device speed.
How long does it take for INP fixes to show up in Google Search Console?
Google Search Console's Core Web Vitals report uses a 28-day rolling window of real-user field data. After you deploy INP fixes, allow up to 28 days before initiating a validation in GSC. The validation process then monitors whether the improvement is sustained. Use PageSpeed Insights lab data and Chrome DevTools for immediate pre-deployment testing — they don't require real-user traffic.
Does scrolling affect my INP score?
No. Scrolling does not count as an INP interaction. INP only measures discrete interactions: mouse clicks, touchscreen taps, and physical or on-screen key presses. Hover events, scroll, and drag are excluded from INP measurement.
My PageSpeed Insights score is 90+, but my INP is still poor. Why?
PageSpeed Insights lab score (the 0–100 number) is calculated from simulated lab conditions and is a weighted composite of multiple metrics — it's not the same as your Core Web Vitals field data. INP only shows up meaningfully in field data because it requires real user interactions. A high performance score means your page loads well in simulation; it doesn't guarantee that post-load interactions are fast. Check the 'Field Data' section of PageSpeed Insights (not the lab score) for your actual INP.
What WordPress plugins cause the worst INP scores?
The most common contributors are heavy page builders (Elementor, Divi, WPBakery), live chat widgets with large JS bundles (Intercom, Drift, Tidio), Google Tag Manager containers with many tags, popup and modal plugins, and WooCommerce on catalog/cart pages. The fastest way to identify which plugin is causing your INP issue is to deactivate plugins one at a time on a staging site and re-test with PageSpeed Insights after each change.
Related reading
Research notes
Background claims used while researching this article. Verify with the cited authorities before quoting.
- INP replaced FID as a Core Web Vital on March 12, 2024
- INP good threshold is 200ms or less at 75th percentile
- scheduler.yield() API for breaking up long tasks
Marcus Chen
Head of Technical SEO · Findvex
Marcus Chen heads technical SEO at Findvex. He writes about Core Web Vitals, indexing, schema, and JavaScript SEO — translating Google’s documentation into checklists small business owners can actually act on.
Expertise: Core Web Vitals · Indexing & crawlability · Schema / structured data · JavaScript SEO
Related reads
Answer Engine Optimization (AEO): The 2026 Guide for Small Businesses
Learn answer engine optimization (AEO) in 2026. This practical guide helps small businesses get found in AI search, voice assistants, and answer engines.
SEOGenerative Engine Optimization (GEO): The 2026 Guide for Small Businesses
Learn how generative engine optimization helps small businesses get found in AI search. Our 2026 GEO guide covers strategies, tactics, and tips to boost visibility.
SEOSEO Agency in USA: AI-Powered SEO for Small Businesses | Findvex
Findvex is a leading SEO agency in USA delivering AI-powered SEO strategies that help small businesses rank higher, drive traffic, and grow revenue. Get started today.