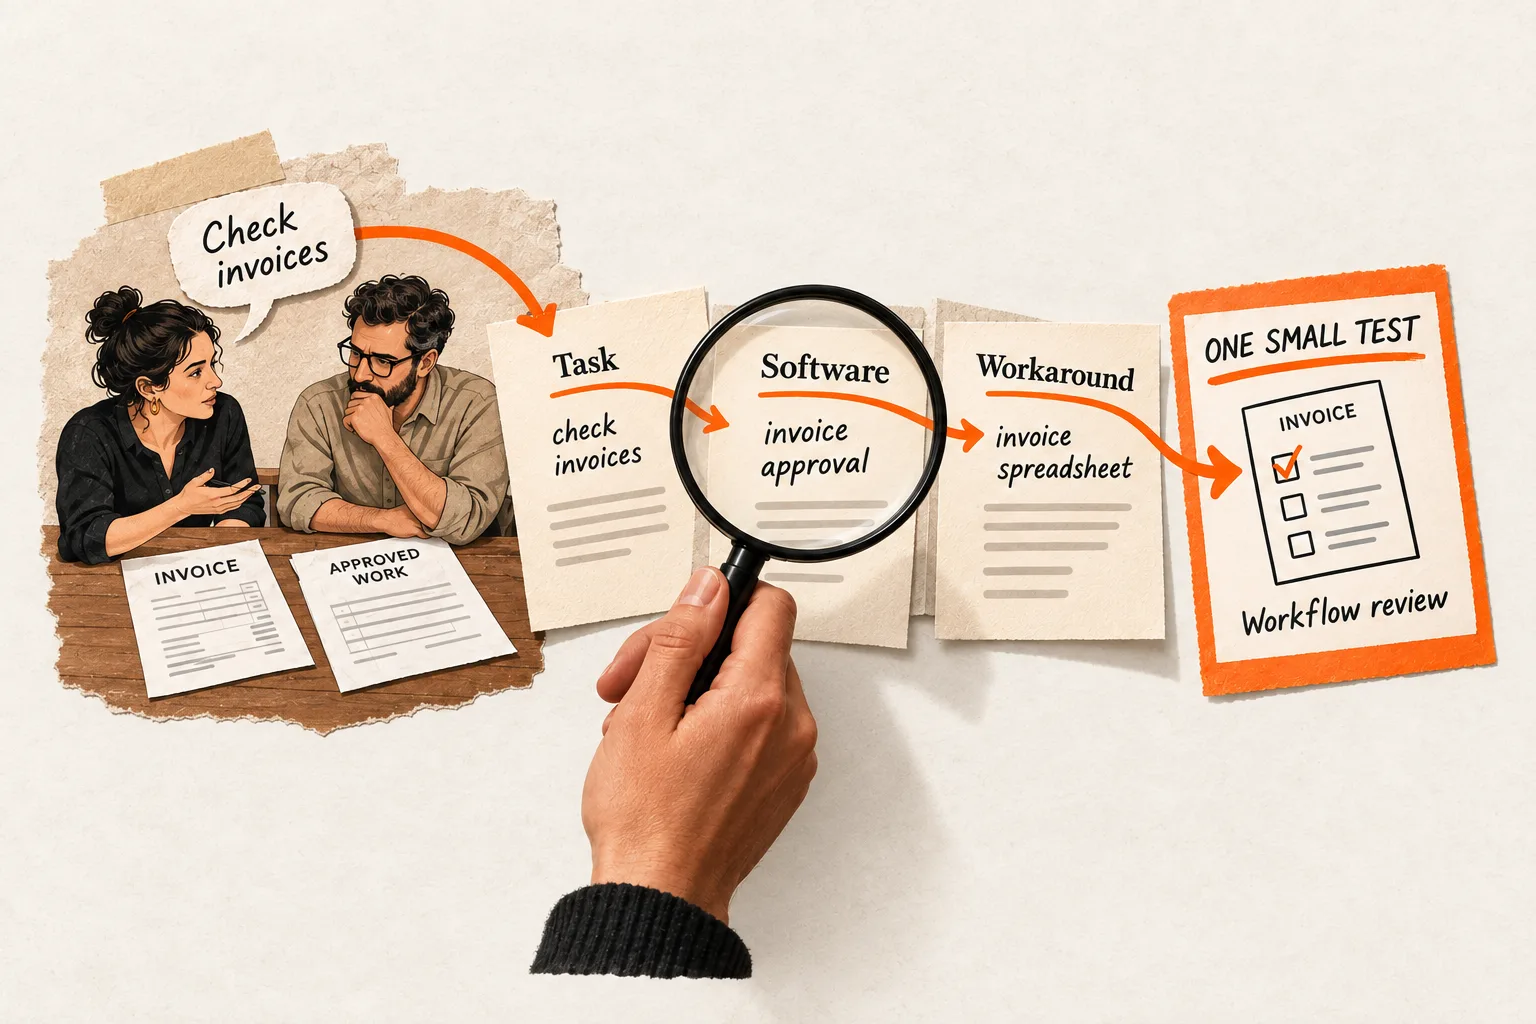
To decide whether an image deserves the extra production time, compare it with a text post on the same customer question. Record qualified responses, reach, and hours spent. Repeat across several topics before changing your content calendar.
The comparison below uses four topics and eight posts from one account. It can help you allocate next month’s effort, though it cannot establish a universal winning format or isolate format as the cause of a result.
Define what counts as qualified interest
Write down one audience and one observable response before drafting. For an AI support tool, that might be a support leader at a small software company asking how to evaluate draft replies against existing tickets.
Count someone as qualified only when they meet your role and company criteria and describe a relevant problem or ask a substantive implementation question. Use information they provide or make public. A job title alone, a friendly comment, or an anonymous website visit does not establish both conditions.
Save the evidence behind each decision. Keep the person’s wording separate from your interpretation, and mark unclear cases as unknown. Record attribution separately: a person can be qualified even when you cannot tell which post prompted the response.
For this worksheet, qualified people are the primary outcome. If your goal is a website action instead, define that action before starting and report it separately from qualified conversations. Combining visits, comments, and form submissions into one score obscures what happened.
Count each person once across the comparison. Someone who comments, sends a message, and later submits a form is one person with several actions. Keep the actions in their record so you can follow their progress without inflating the total.
Match the teaching task across two formats
Start with two formats you can produce consistently, such as text and a post with one explanatory image. Choose four recurring customer questions from actual conversations or documented public discussions. The pain-point evidence sheet guide can help you preserve source language and distinguish recurring problems from isolated remarks.
For each question, prepare both versions with the same central claim, supporting example, and next step. A diagram can explain the workflow that the text version describes in sentences. Let the presentation fit the format while keeping the information comparable.
Within each pair, keep the publishing account, intended audience, destination page, call to action, and link placement steady. Use comparable opening promises and the same approach to replies, promotion, and follow-up.
If the image version adds a stronger example or a different offer, record that difference. Your results will compare those creative packages, making it harder to judge the contribution of format alone.
Schedule four pairs with balanced ordering
Eight posts over four weeks is a manageable starting workload, not a statistically sufficient sample size. Choose two recurring publishing slots that fit your routine. Each topic appears in the same slot a week apart.
Before assigning topics, randomly select two to receive text first; the other two receive the image first. One possible schedule is:
| Week | Slot A | Slot B |
|---|---|---|
| 1 | Topic 1: text | Topic 2: image |
| 2 | Topic 1: image | Topic 2: text |
| 3 | Topic 3: image | Topic 4: text |
| 4 | Topic 3: text | Topic 4: image |
This adapts the logic of blocking: hold a background factor such as topic comparable while varying the factor you want to examine. NIST describes blocking and randomization as ways to address factors that could otherwise distort an experiment. This organic comparison borrows that logic without controlling who sees each post. NIST’s guide to randomized block designs
Readers may see both versions, familiarity may affect the second post, and the audience can change between dates. Balancing the order cannot remove those effects.
Keep promotion consistent across posts. Record unusual events, including a large repost, a product launch, a boost, or a broken link. Leave affected results visible and note whether the pair needs another comparison.
Attribute responses without counting people twice
Give every post an ID, such as p01_text or p01_image. Use it in the worksheet and, when linking to your site, in the URL’s utm_content value. Keep the other campaign labels consistent:
utm_source=linkedin
utm_medium=social
utm_campaign=support_format_test
utm_content=p01_text
Change utm_content for each post. Google documents this parameter as a way to distinguish creatives; campaign parameters identify referring campaigns in Analytics. Values are case sensitive, so use consistent lowercase names. Google’s campaign URL guidance
Before starting, check that the destination loads, parameters survive redirects, and the intended website action is recorded. Keep your test activity separate where possible.
For identifiable responses, use this counting rule consistently:
- Assign a qualified person to one post when their response explicitly references it and you have no evidence of interaction with another test post before qualification.
- If several test posts contributed before qualification, record all known post IDs and count the person once in a shared-exposure group. Keep that group outside the individual-post totals.
- If someone names LinkedIn but no post, record LinkedIn with the format unknown. Do not guess from publication dates.
Record only the exposure you can observe or the person reports. This rule makes attribution consistent; it does not establish their complete path.
UTMs have similar limits. A forwarded link can retain the original label, while a later direct visit may lack it. Keep tracked website activity and explicitly attributed conversations as separate evidence.
Read qualified responses alongside reach and effort
Capture each post’s results at the same age, such as seven days after publication. Choose the window in advance, wait until the final post completes it, and log later responses separately. The cutoff makes the comparison consistent but misses some delayed interest.
On desktop, open a post’s analytics through its impressions count or View analytics. Available categories depend on the post type. LinkedIn’s analytics instructions
LinkedIn defines impressions as times a post was shown and members reached as distinct members and Pages that saw it. External-link visits include repeat clicks. LinkedIn also describes its analytics figures as estimates. None of these counts establishes whether someone meets your qualification rule. LinkedIn’s metric definitions
Compare qualified people per post first, with impressions, tracked sessions, and production time alongside them. Qualified people per 1,000 impressions can be a useful descriptive ratio, but it is not a visitor conversion rate: impressions are not unique visitors. Track follow-up time separately so production efficiency does not stand in for total effort.
Worked example: one topic accounts for the advantage
Suppose a founder completes four topic pairs for an AI support product. All numbers below are hypothetical. Each qualified person is counted once across the test and attributed to one post; shared and unknown attribution cases are excluded from these format totals.
| Results within seven days of each post | Text | Image |
|---|---|---|
| Posts | 4 | 4 |
| Impressions | 4,000 | 8,000 |
| Tracked website sessions | 40 | 56 |
| Qualified people | 6 | 8 |
| Production hours | 2 | 6 |
Images averaged two qualified people per post; text averaged 1.5. Per 1,000 impressions, the descriptive ratios were one qualified person for images and 1.5 for text. Text also recorded three qualified people per production hour, compared with about 1.3 for images. These effort ratios exclude follow-up time.
The image posts recorded more qualified interest overall and took three times as long to produce. The topic pairs show why the founder should hesitate before making images the default:
| Topic | Text: qualified people | Image: qualified people |
|---|---|---|
| 1 | 2 | 1 |
| 2 | 1 | 1 |
| 3 | 2 | 1 |
| 4 | 1 | 5 |
The entire image advantage comes from topic four. Without that pair, text has five qualified people and images have three. Keep all four pairs in the report; this check shows how dependent the total is on one result.
If production time is tight, a reasonable next decision is to keep text as the routine format and try another diagram on a similar workflow question. The fourth topic suggests something worth repeating, but it does not establish that images generally perform better.
Copy the planning and measurement worksheet
Complete this planning template before publishing:
Audience and company criteria:
Response that qualifies someone:
Primary outcome:
Rule for counting each person once:
Attribution and shared-exposure rule:
Two formats:
Four matched customer questions:
Destination and call to action for each pair:
Publishing slots and format order:
Observation window:
Production-time budget:
Decision this comparison will inform:
Final review date:
Use one row per post for the measurements:
Post ID | URL | Topic | Format | Published at | Measured at |
Impressions | Members reached, if available | Tracked sessions |
Qualified people assigned to this post | Production minutes |
Follow-up minutes | Unusual events
Keep a separate person-level record to support the counts:
Person ID | Qualification evidence | Qualified, unqualified, or unknown |
First qualifying response and date | Known post IDs |
Attribution evidence | Assigned post, shared exposure, or unknown |
Later actions
Review the topic pairs before the combined totals. Check whether one post drives the apparent advantage and whether one additional response would change your decision. If it would, keep the conclusion provisional.
Eight posts with sparse responses cannot settle small performance differences. More impressions do not automatically create more independent experimental observations, and zero qualified responses do not prove a format never works. Check the audience, topic, next step, and tracking before increasing production.
Set up the first two pairs
Choose two customer questions and add their paired posts to your weekly LinkedIn routine. Fill in the qualification rule, attribution rule, production budget, and review date before drafting either format. Your closing decision should name what you will produce next and what still needs another comparison.